
SaaS Glossary
The technical terms every SaaS founder needs to master, explained clearly: recurring revenue, retention, acquisition, product and finance.
Recurring revenue and billing
How to measure and break down the revenue that recurs every month in your SaaS.

MRR
MRR (Monthly Recurring Revenue) is the monthly recurring revenue of a SaaS: the sum of all active subscriptions normalized to a month. It is the core metric of a subscription business because it shows, predictably, how much the company earns on a recurring basis each month, without counting one-off charges.

ARR
ARR (Annual Recurring Revenue) is the annual recurring revenue of a SaaS: MRR multiplied by 12. It represents how much the company earns on a recurring basis over a year, counting only active subscriptions, with no one-off charges. It is the metric of choice for companies selling annual contracts and the standard language of investors.

MRR Movements
MRR movements are the breakdown of the monthly change in MRR into its causes: new, expansion, contraction, churn and reactivation MRR. Instead of watching only the final number, you separate every dollar that came in and every dollar that left, and see why recurring revenue grew, stalled or fell. The sum of all movements is the net new MRR for the period.

Committed MRR (CMRR)
Committed MRR (CMRR) is the committed monthly recurring revenue of a SaaS: it starts from current MRR, adds the contracts already signed that are still due to activate, and subtracts the losses that are already certain, such as cancellations customers have already announced. It is a more realistic view of future recurring revenue than the MRR of the current month, because it factors in what is already closed but not yet reflected in the current number.

Run rate
Run rate is annualized revenue projected from a recent period, for example one month of MRR multiplied by 12 or a quarter of revenue multiplied by 4. It extrapolates the current pace of the business as if it would stay constant for a year. It is useful for a quick read of scale, but dangerous when the period used is not representative.

ARPU
ARPU (Average Revenue Per User) is the average recurring revenue per user of a SaaS: recurring revenue divided by the number of active users. Unlike ARPA, which divides by account, ARPU looks at the person, which makes sense in products priced per seat. It is a measure of how much each user is worth, on average, each month.

ARPA
ARPA (Average Revenue Per Account) is a SaaS recurring revenue divided by the number of active accounts. It shows how much each account generates, on average, per month or year. It is the metric that reveals the typical value of a customer and one of the main levers for growing revenue without relying only on new sales.
GMV
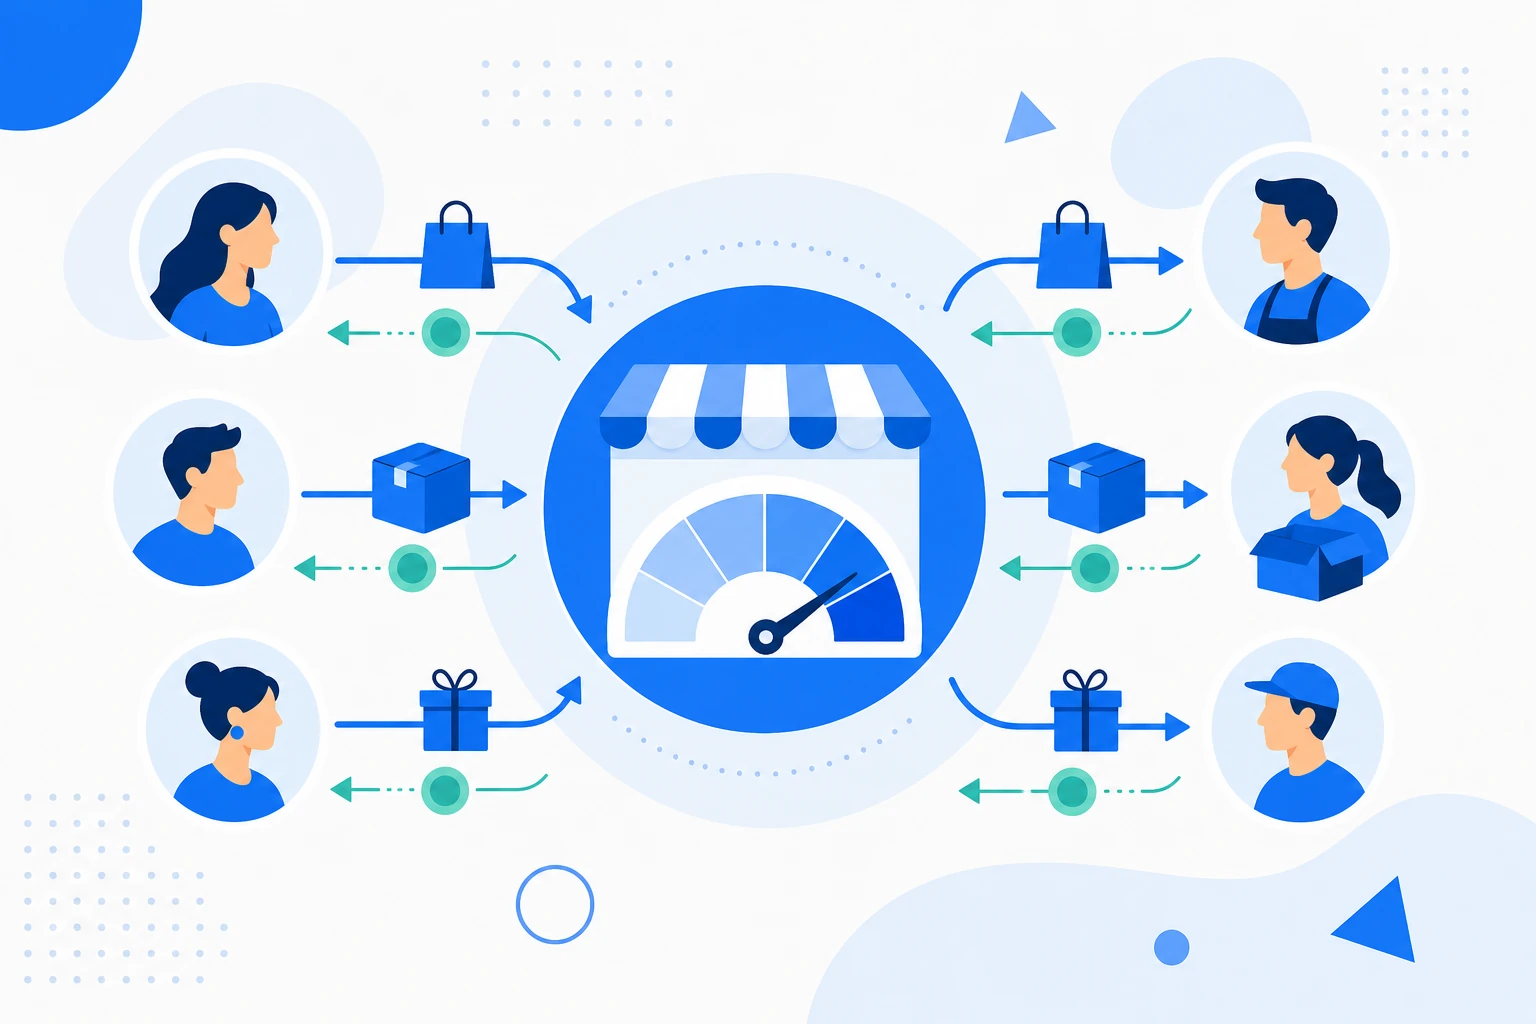
GMV (Gross Merchandise Value) is the total value of the transactions flowing through a platform or marketplace in a period. It is not the company revenue: revenue is the take rate charged on that volume. It is the scale metric of marketplaces and transactional SaaS, showing the size of the flow the business moves.

Gross vs net revenue
Gross revenue is the total billed in a period, before any deduction; net revenue is what remains after discounts, refunds, gateway fees and taxes. Gross shows the size of billing, while net reveals the real revenue the company keeps and that funds its margin. In a SaaS, separating the two avoids overstating growth and distorting revenue recognition.

Non-recurring revenue
Non-recurring revenue is the revenue from one-off, non-repeatable items of a SaaS, such as setup, implementation, professional services and training. It stays out of MRR and ARR because it does not renew: it inflates total billing, but not recurring revenue. That is why it should be measured and recorded separately from subscriptions.
Retention and churn
How much of your customer base and revenue you keep over time.

Churn
Churn is the loss of customers or revenue in a period. In a SaaS, it measures how many customers cancel (customer churn) or how much recurring revenue disappears (revenue churn). It is the metric that reveals whether growth is sustainable: the higher the churn, the more new sales you need just to avoid shrinking.

Net Revenue Retention (NRR)
Net Revenue Retention (NRR) measures how much of the recurring revenue from your current base you keep over time, already accounting for upgrades and expansion, minus downgrades and cancellations. Above 100% it means the base grows on its own, even without new customers.

Gross Revenue Retention (GRR)
Gross Revenue Retention (GRR) measures how much of the recurring revenue from your current base you keep over time counting only the losses, contraction and cancellations, and ignoring any expansion. That is why it never goes above 100%: it shows the pure leakage of the base.

Revenue retention
Revenue retention is how much of the recurring revenue from an existing customer base keeps coming in over time, without counting new sales. It is an umbrella measured two ways: gross (GRR), which counts only losses from churn and downgrades, and net (NRR), which adds expansion from within the base. Unlike customer retention, which counts logos, here what matters is the revenue in money.

Gross MRR churn
Gross MRR churn is the percentage of recurring MRR a company loses to cancellations and downgrades in a period, with no expansion subtracted. It is always positive and never exceeds 100%, because it measures only the revenue leaking out of the existing base. It works as the worst case of retention: how much the company would lose if it recovered nothing in return.

Net MRR churn
Net MRR churn is the recurring revenue lost to cancellations and downgrades, minus the expansion generated by the same base in the same period, all over the MRR at the start of the period. Unlike gross churn, it subtracts expansion, so it can go negative when the customers who stay grow more than the ones who leave, what is called negative churn.

Customer churn
Customer churn (or logo churn) is the percentage of customers or accounts that cancel in a period, counted by number of logos rather than by revenue. It tells you how many companies you lost, regardless of how much each one paid. It differs from revenue churn when those who cancel pay above or below your average deal.

Retention rate
The retention rate is the percentage of customers or revenue that stays active at the end of a period. It is the direct complement of churn: if the annual customer churn rate is 8%, customer retention is 92%. It measures the loyalty of the base and helps forecast future recurring revenue.

Logo retention
Logo retention is the percentage of accounts (logos) a SaaS company keeps over a period, without looking at how much each one pays. It is the mirror of customer churn: it counts heads, not revenue. That is why it can diverge sharply from revenue retention when a few large customers concentrate the MRR.

Voluntary churn
Voluntary churn happens when a customer actively decides to cancel the subscription, driven by price, low perceived value, a change of need or competition. It is the opposite of involuntary churn, which comes from payment failures. You fight it with activation, delivered value and product, not with billing.
Involuntary churn
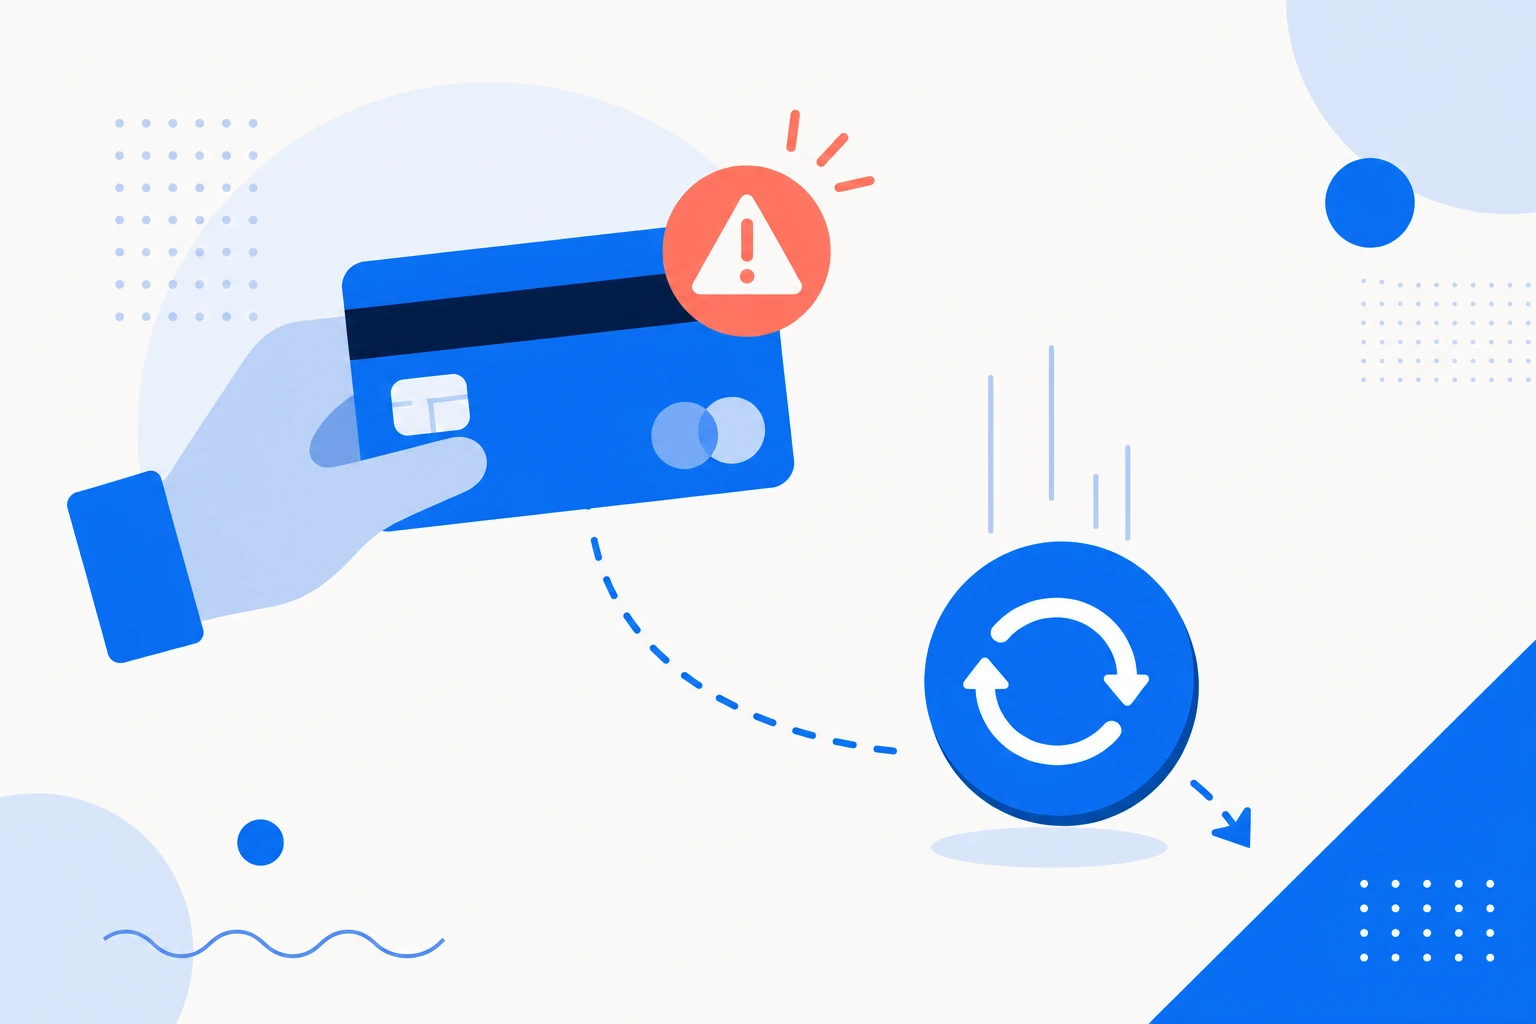
Involuntary churn is the cancellation of a subscription caused by a payment failure, such as a declined, expired or maxed-out card, rather than a customer decision. It usually accounts for a meaningful slice of total churn and is highly recoverable with dunning, that is, payment retries and requests to update the card.

Customer health score
A customer health score is a composite score that estimates the health and risk of each customer by combining signals of product usage, engagement, support and payment. It exists to act before churn and to prioritize the accounts with the most value at risk. It is not a magic number, but a method to turn scattered signals into a single, actionable reading.

Customer lifetime
Customer lifetime is the average time a customer stays active and paying for a SaaS. It is estimated simply as 1 divided by the churn rate: with 2% monthly churn, the average lifetime lands around 50 months. It is the base of LTV, because the longer a customer stays, the more revenue they generate before they cancel.
Acquisition and unit economics
The cost of winning customers and the value they generate over the relationship.

CAC
CAC (Customer Acquisition Cost) is how much, on average, you spend to win a new customer. Add up everything invested in marketing and sales over a period and divide by the number of new customers who came in during that period. It is the metric that tells you whether your growth is economically healthy.

LTV / CLV
LTV (Lifetime Value), also called CLV or CLTV, is the total value a customer generates while they stay in your base. In a simple form, it is the recurring average revenue times margin times the customer lifetime. It is the metric that shows how much it is worth investing to win and keep each customer.

CAC payback
CAC payback is the time, in months, a customer takes to return the CAC in recurring margin. Divide the CAC by the monthly gross margin each customer generates (recurring revenue per customer times gross margin). It is the metric that shows how fast the acquisition investment comes back to cash.

Payback period
The payback period is the time an investment takes to pay for itself, that is, to return in cash what it cost. In SaaS, it almost always refers to CAC payback: how many months of recurring gross margin a customer takes to recover the cost of acquiring them. The shorter the payback, the faster cash comes back and the more efficient growth is.

Cost per lead (CPL)
Cost per lead (CPL) is the marketing spend of a period divided by the number of leads generated in that period. It measures how much it costs, on average, to attract an interested contact, and it sits before CAC in the acquisition funnel. It is mainly used to compare channels, as long as you also look at the quality and conversion of the leads, not just the price.

SaaS magic number
The SaaS magic number is a sales and marketing efficiency metric. It divides the new ARR generated in a period by the sales and marketing (S&M) spend of the prior period. Above 1 is excellent and lets you accelerate investment, between 0.5 and 1 is healthy, and below 0.5 raises an efficiency warning.

Trial-to-paid conversion
Trial-to-paid conversion is the share of free trials that become paying customers: paid conversions divided by trials started. It is the central metric of self-serve products and it varies widely depending on whether the trial requires a card (opt-out, roughly 40% to 60%) or not (opt-in, roughly 10% to 25%). Activation during the trial is the strongest predictor of who converts.

Freemium conversion
Freemium conversion is the percentage of users on a permanent free plan who become paying customers. It tends to be low, typically between 2% and 5%, because free attracts many people with no intent to pay. The model pays off on volume and expansion, not on a high rate.

Activation rate
Activation rate is the share of new users who reach the product first real value (the aha moment or setup milestone) within a defined time frame. It is the bridge between acquisition and retention: those who activate tend to stay, those who do not tend to churn. That makes it one of the strongest predictors of retention and the silent bottleneck of trial conversion in SaaS.
MQL / SQL
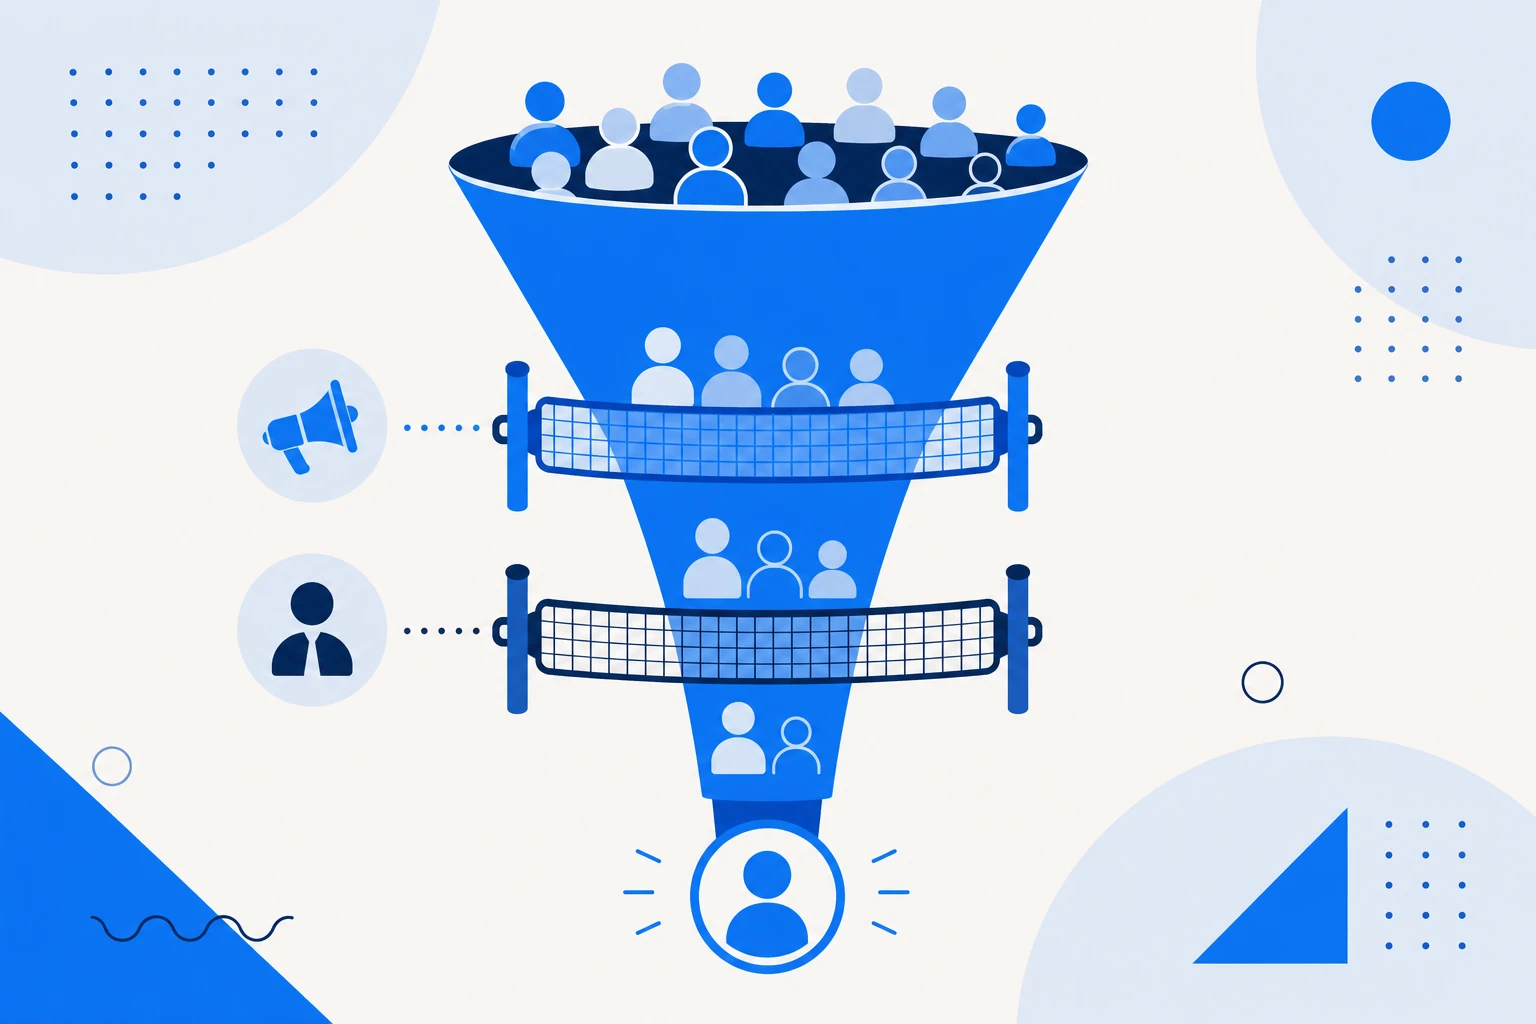
MQL (Marketing Qualified Lead) is the lead that marketing has qualified as interested enough to pass to sales; SQL (Sales Qualified Lead) is the lead that sales has validated as a real opportunity. They are successive stages of qualification in the funnel (Lead, MQL, SQL, Opportunity), and the MQL to SQL conversion rate measures alignment between the two teams.

Product Qualified Lead (PQL)
A Product Qualified Lead (PQL) is a lead qualified by product usage itself, not by marketing or sales. It is someone who reached a value milestone inside the tool, such as activating a core feature or hitting a usage limit, signaling real buying intent. It is the native lead of product-led growth and tends to convert far more than a lead qualified by profile alone.

Viral coefficient (K-factor)
The viral coefficient, or K-factor, measures how many new users each current user brings on average. It is calculated by multiplying the number of invites sent per user by the conversion rate of those invites. A K above 1 produces self-sustaining viral growth; below 1, virality only amplifies other channels rather than replacing them.

ROAS
ROAS (Return on Ad Spend) is the return on money invested in ads: the revenue a campaign generates divided by the amount spent on it. A ROAS of 4 means $4 of revenue for every $1 of ad. Unlike CAC, which sums the full cost of acquisition, and ROI, which looks at profit rather than revenue, ROAS measures only the efficiency of paid media.
Growth and efficiency
How fast the SaaS grows and how much capital that growth consumes.

Growth rate
Growth rate measures how fast a SaaS revenue (or customer base) moves between two periods, expressed as a percentage. It can be monthly (MoM), yearly (YoY) or quarterly, and the formula is always the change divided by the starting value. The YoY view smooths seasonality, while compound MoM reveals whether the business is accelerating or slowing down.

CAGR
CAGR (Compound Annual Growth Rate) is the compounded annual growth rate: the constant average rate that, applied year after year on a compound basis, takes a value from its starting point to its ending point over N years. The formula is (ending value ÷ starting value) to the power of (1/N), minus 1. It condenses several years of uneven growth into a single, comparable annual rate.

Rule of 40
The Rule of 40 is a health check for SaaS companies that adds the revenue growth rate to the profit margin: the result should be 40% or higher. It balances two goals that usually compete, growing fast and turning a profit, into a single number. Above 40 the business combines growth and profitability sustainably; below it, a warning light comes on.

SaaS quick ratio
The SaaS quick ratio is a growth-efficiency measure: it divides recurring revenue gained (new plus expansion) by recurring revenue lost (churn plus contraction) over the same period. A result above 4 signals efficient, healthy growth; near 1, the company gains about as much as it loses. Despite the name, it has nothing to do with the accounting quick ratio of liquidity.
Financial health and accounting
Cash, margins, profit and the accounting concepts that hold the business up.

Gross margin
Gross margin is the share of revenue left after the direct cost of delivering the service: (revenue minus COGS) divided by revenue, as a percentage. Pure SaaS usually runs between 70% and 85% or more, and that headroom is what sustains the model, feeds LTV and funds reinvestment in growth.

COGS
COGS (Cost of Goods Sold) is the direct cost of delivering a SaaS service: hosting and infrastructure, customer support, third-party fees and payment processing. It does not include sales, marketing or R&D, which are OpEx. It is the base of gross margin: revenue minus COGS equals gross profit.

Gross profit
Gross profit is revenue minus COGS, the direct cost of producing and delivering the product or service. It is the first profit line on the income statement, taken before operating expenses, interest and taxes. Divided by revenue, it gives the gross margin, which in SaaS tends to be high because the cost of serving each additional customer is low.

Contribution margin
Contribution margin is revenue minus variable costs, measured per unit or in total. It is what each sale leaves over to cover fixed costs and, after that, become profit. Unlike gross margin, which subtracts all of COGS, it isolates only what changes with volume, which is why it underpins break-even analysis and pricing decisions.

Operating margin
Operating margin is operating profit divided by revenue: how much of each dollar of revenue is left after paying the cost of service (COGS) and operating expenses (OPEX), before interest and taxes. It measures the profitability of the operation itself, with no effect from capital structure or taxes. In SaaS, it is the profitability component that adds to growth in the Rule of 40.

EBITDA
EBITDA (earnings before interest, taxes, depreciation and amortization) measures the result a company generates from its operations, before decisions about financing, taxation and how past investments are accounted for. It starts from operating profit and adds depreciation and amortization back, approximating operating cash generation and letting you compare companies with different capital structures. It is not cash flow: it ignores capex and changes in working capital.

Net income
Net income is the last line of the income statement, the so-called bottom line: what is left of revenue after subtracting all costs, operating expenses, interest and taxes. It is the final accounting profit, different from cash (because it follows accrual accounting) and from EBITDA (which excludes interest, taxes, depreciation and amortization). Many growth-stage SaaS run negative net income while reinvesting to capture market.

Break-even
Break-even is the level of revenue or units sold at which the company result is zero: revenue covers exactly all costs. In units, it equals fixed costs divided by the unit contribution margin. Above it every sale turns into profit; below it, into loss, which is why reaching it is the milestone that frees a startup from depending on external cash.

Cash flow
Cash flow is the difference between the money coming into a company and the money going out over a period. It splits into operating, investing and financing, and it is not profit: cash is what actually moves through the account. In SaaS, billing annual contracts upfront brings cash forward relative to recognized revenue.

Free cash flow
Free cash flow (FCF) is the cash left from operations after paying for capital investments (capex). It is the money truly available to pay down debt, reward investors or reinvest in growth. A SaaS that generates positive FCF funds itself and depends less on raising rounds.

Burn rate
Burn rate is the speed at which a company consumes its cash, almost always measured per month. Gross burn adds up all the money going out; net burn subtracts the revenue coming in and shows what actually drains the cash. It is the denominator of runway: the lower the burn, the more time a startup has before it needs new capital.

Runway
Runway (cash runway) is how many months a company can keep operating on the cash it has, at its current burn rate. You calculate it by dividing available cash by the monthly net burn, and it sets the urgency to raise money or reach break-even. It is the financial breathing room that buys time to get the business right.

Working capital
Working capital is current assets minus current liabilities: the short-term resources a company has to run its day-to-day operation. It shows whether receivables, cash and inventory cover the obligations coming due in the next few months. In SaaS, billing upfront and paying suppliers later can produce negative working capital, and in that model it is usually a sign of health, not of strain.

OPEX / CAPEX
OPEX (operating expenses) are the recurring day-to-day costs, such as salaries, marketing and cloud, booked as expense in the period they happen. CAPEX (capital expenditure) is money put into long-lived assets, capitalized on the balance sheet and depreciated over years. The difference changes when and how each cost shows up on the income statement and in cash flow, and modern SaaS is almost entirely OPEX.

Unit economics
Unit economics is the economics of a single unit of a SaaS, which is usually a customer or an account: how much that unit generates in revenue and margin over the whole relationship versus what it costs to acquire and serve. The central pair is LTV against CAC, with a healthy ratio above 3, plus the CAC payback period. Healthy unit economics is what lets a company grow without burning cash indefinitely.

Valuation
Valuation is the estimate of what a company is worth at a given moment. In SaaS, the most common shortcut is a multiple on ARR, and that multiple rises or falls with growth, retention and efficiency, synthesized by the Rule of 40. Valuation also sets how much equity an investor gets for their check, separating pre-money (before the check) from post-money (after).

Cap table
A cap table, or capitalization table, is the record of who owns what in a company: founders, investors and the employee option pool, always adding up to 100%. It lists shares, percentages and share classes, and it is rewritten at every funding round, when new investment dilutes the existing holders. It is the basis for negotiating valuation and the term sheet.

Dilution
Dilution is the drop in existing owners' percentage when the company issues new shares, typically in a funding round or when creating the option pool. You end up with a smaller slice of a hopefully bigger pie. Added up across rounds, dilution defines how much founders still hold at the end.

SAFE
A SAFE (Simple Agreement for Future Equity) is the investment contract created by Y Combinator where an investor puts capital in now and converts that amount into equity at a future priced round, without setting a valuation up front. It uses a valuation cap and/or a discount to reward the risk of coming in early. It is not debt: there is no interest and no maturity date.

Term sheet
A term sheet is the mostly non-binding document that summarizes the key terms of an investment round: valuation, investment amount, ownership, liquidation preference, voting rights and governance. It is the basis for the definitive contracts and aligns expectations before due diligence. Reading beyond the valuation is essential, because the economic and control clauses weigh as much as the headline number.

Down round
A down round is a funding round raised at a lower valuation than the previous one. It signals that the market or the company performance did not hold up the old price, dilutes shareholders more, and can trigger anti-dilution provisions. Even so, it is sometimes the rational alternative to running out of cash, especially when the runway tightens and the prior valuation was stretched too far.
Product and engagement
How customers use the product and reach the value it delivers.

Aha moment
The Aha moment is the instant a user first perceives the real value of a product, the click that turns a curious visitor into an engaged user. Identifying which concrete action represents that moment and getting users to it as fast as possible is the foundation of activation and retention. Classic examples are sending the first message, inviting the first teammate or importing the first data.

Onboarding
Onboarding is the process that takes a new customer from welcome to first value, the aha moment, and from there to the habit of using the product. Good onboarding shortens time to value and lifts activation and retention, while poor onboarding is one of the top causes of early churn. It can be self-serve, guided by the product, or assisted by people.

Time to value (TTV)
Time to value (TTV) is the time between signup and the moment the customer gets the first real value from the product, the so-called aha moment. The shorter that interval, the higher the odds of activating, converting the trial and retaining. Shortening TTV is one of the central goals of onboarding, because every extra step before value drags conversion down.

DAU / MAU
DAU and MAU are the daily active users (Daily Active Users) and monthly active users (Monthly Active Users) of a product. The DAU/MAU ratio, obtained by dividing average DAU by MAU, is the stickiness metric: it shows what fraction of monthly users comes back on a typical day. Near 50% indicates a product of daily use; a low ratio indicates occasional use. The number only means something if "active" is defined honestly.

Engagement rate
Engagement rate measures how intensely the base uses the product: the share of users who perform the key value action in a period. There is no single formula, each product defines that action. High engagement precedes retention and expansion; low engagement precedes churn.

Power users
Power users are the small fraction of a product most engaged and frequent users, who get the most out of it and tend to generate a disproportionate share of activity and value, a Pareto effect. They are the main source of expansion, referrals and feedback, and understanding what makes them power users guides the roadmap and the onboarding of everyone else.

North Star Metric
The North Star Metric is the single guiding metric that best captures the value a product delivers to its customers and predicts sustainable growth. It sits above the input metrics that feed it and aligns every team around real value, not vanity numbers. Chosen well, it rises when the customer wins, not when the company extracts.

Product-led growth (PLG)
Product-led growth (PLG) is the growth strategy in which the product itself drives acquisition, activation, conversion and expansion, with little or no sales touch. The user enters through a free trial or a freemium plan, feels the value on their own and becomes a paying customer. The buying signal is no longer a filled-in form but usage: the PQL, the lead qualified by the product.

NPS
NPS (Net Promoter Score) is a loyalty index based on the question "on a scale of 0 to 10, how likely are you to recommend us?". It is calculated by subtracting the percentage of detractors (scores 0 to 6) from the percentage of promoters (scores 9 and 10); passives (7 and 8) do not count. The result ranges from -100 to +100 and measures loyalty and word of mouth, not point-in-time satisfaction.

CSAT
CSAT (Customer Satisfaction Score) is the metric that measures customer satisfaction with a specific interaction, product or moment, calculated as satisfied responses divided by the total, as a percentage. It is point-in-time and transactional, capturing the feeling in the heat of the moment, unlike NPS, which measures long-term loyalty, and CES, which measures effort. Each touchpoint can have its own CSAT.

CES
CES (Customer Effort Score) is the customer effort score: it measures how much work a person had to put in to complete a task with your company, resolve a ticket, turn on a feature or finish a purchase. The typical question is "how easy was it?". Low effort predicts loyalty better than trying to delight, which is why CES complements NPS and CSAT.

A/B testing
A/B testing is an experiment that randomly splits users between two versions, A (control) and B (variant), to measure which produces a better outcome on a chosen metric, such as conversion, activation or engagement. It exists to decide with data instead of opinion, but it is only reliable with enough sample and statistical significance, so you do not mistake luck for effect. It is the engine of continuous optimization in self-serve products.
Subscription, pricing and billing
Pricing models, plans and the mechanics of recurring billing.

Freemium
Freemium is a business model with a permanent free plan that never expires and gives access to a subset of features, plus paid plans that unlock the rest. It exists to attract users in bulk at low cost and convert a fraction of them, typically 2% to 5%, into paying customers. The challenge is offering a free tier useful enough to attract, yet limited enough to create a reason to pay.
Free trial
A free trial is time-limited, or usage-limited, access to a product so the user can experience its value before paying. Unlike freemium, which is free forever, a free trial has an expiry date and exists to prove the product and convert the user into a paying customer. It can be opt-in, with no card required, or opt-out, with a card at sign-up.

Reverse trial
A reverse trial is a strategy in which the user starts with full access to the paid plan for a period and, when it ends, drops to a free plan if they do not convert, instead of losing everything. It combines the hook of a premium trial with the safety net of freemium: it shows the full value of the product and then creates longing for the paid features. It works best for products with a fast aha, where the user feels value in the first few days.

Value-based pricing
Value-based pricing sets the price from the value perceived and delivered to the customer, not from production cost nor only from what competitors charge. It anchors price to each segment willingness to pay, which tends to capture more revenue. It depends on understanding value per persona and choosing a good value metric.

Usage-based pricing
Usage-based pricing is the billing model where the bill grows as the customer consumes the product, measured by a usage metric such as API calls, gigabytes or events. It aligns cost with the value delivered and lowers the barrier to entry, but makes revenue less predictable. It can be pure, with no subscription, or hybrid, a base subscription plus usage overage.

Expansion
Expansion (expansion revenue or expansion MRR) is the additional recurring revenue that comes from customers you already have, without relying on new sales. It comes from upsell (higher plan), cross-sell (more products), add-ons and usage growth. It is the force that pushes net revenue retention above 100% and makes the base grow on its own.

Upsell
Upsell means moving a customer who already uses your product to a higher plan or more of the same product: more seats, a higher tier, a larger limit. It is one of the main drivers of expansion and of the revenue that pushes NRR above 100%. Unlike cross-sell, which sells a complementary product, upsell deepens the use of what the customer already bought.

Cross-sell
Cross-sell (cross-selling) is selling a customer who already uses one product a second, complementary product, module or add-on. It grows revenue per account and stickiness, because the more products a customer uses the more expensive it is to leave, all without a plan change. Together with upsell, it is one of the two levers of base expansion.

Add-on
An add-on is a module, feature or capacity billed on top of a SaaS base plan: extra seats, more storage or a standalone premium feature. It works as a mechanism of expansion and modular pricing, where the customer assembles their own package and revenue per account grows without having to change plan.

Contraction
Contraction is the recurring revenue lost from customers who stay on your base but start paying less: a plan downgrade, fewer seats, a removed add-on. It is not churn, because the customer did not cancel, yet it still lowers MRR and drags net revenue retention down. It is one of the negative components of MRR movements.

Grandfathering
Grandfathering is the practice of keeping current customers on the old price or plan after a price increase or repackaging, while new customers move to the new terms. It reduces friction and churn in the short term, but it caps revenue and makes the base harder to manage over time. The alternative is migrating everyone with notice and incentives.

Payment gateway
A payment gateway is the service that sits between the customer and the bank (or acquirer) and processes each charge: it authorizes the card, tokenizes the data so it never lives in your system, and retries payments that fail. In subscription SaaS, a good gateway with smart retries recovers declined charges and reduces involuntary churn. Stripe and Asaas are examples.

Chargeback
A chargeback is the forced reversal of a charge: the customer disputes the purchase with their bank or card network and the money goes back to them, undoing the sale. Beyond the lost revenue, the business also pays a fee to its acquirer and, if the chargeback rate climbs too high, risks restrictions on its account. It is a form of involuntary churn and, often, of fraud.
Sales and go-to-market
How the SaaS reaches the market and turns opportunities into sales.

Go-to-market (GTM)
Go-to-market (GTM) is the strategy for how a company takes a product to market: who the target customer is, through which channels, with what message, pricing and sales motion. It is not just the launch, it is the system that connects the product to revenue. The three main motions are product-led, sales-led and marketing-led, almost always combined.

ICP
The ICP (Ideal Customer Profile) describes the type of company that gets the most value from your product and gives the most back in retention, expansion and referrals. It combines firmographics (industry, size, geography), the real need the product solves and fit criteria. Focusing on the ICP lowers CAC and improves retention; targeting outside it inflates cost and churn.

Product-market fit (PMF)
Product-market fit (PMF) is the fit between the product and a strong, real market demand, the point where the product starts to pull on its own. The signals are retention that flattens, organic growth and word of mouth, and a large share of users who would be very disappointed without the product. Without PMF, scaling acquisition only accelerates churn.

TAM / SAM / SOM
TAM, SAM and SOM are three nested market sizes. TAM (Total Addressable Market) is the total demand if you served everyone; SAM (Serviceable Available Market) is the slice your product and model actually serve; SOM (Serviceable Obtainable Market) is what you can realistically capture in the near to medium term. Together they frame ambition, focus and the valuation narrative.

Sales cycle
The sales cycle is the average time an opportunity takes from first contact to closed deal, moving through qualification, demo, proposal and negotiation. Short cycles enable a low CAC and fast cash; long cycles need a high deal size to justify the effort. Shortening the cycle improves sales efficiency and CAC payback.

Win rate
Win rate is the share of opportunities that turn into closed sales: deals won divided by the total deals closed (won plus lost) in a period. It measures commercial efficiency and the quality of the pipeline and qualification. A low win rate with high volume usually points to poorly qualified leads or weak fit, and raising the rate is one of the most direct ways to lower CAC.
Average selling price (ASP)
ASP (Average Selling Price) is the average value of the new contracts a company closes: total new-business revenue divided by the number of deals in a period. It reflects the segment the company serves (self-serve low, SMB mid, enterprise high) and determines how much CAC and how long a sales cycle the model can bear. A high ASP sustains a human sales motion; a low ASP demands self-serve.

Sales-led growth (SLG)
Sales-led growth (SLG) is the growth model in which a sales team drives customer acquisition and expansion, using demos, proposals and negotiation to guide the buyer to the contract. It is the default for high-ticket, complex sales where the product alone does not close the deal. It contrasts with product-led growth, and many companies combine both models.

Account-based marketing (ABM)
Account-based marketing (ABM) is a B2B strategy that treats specific high-value target accounts as "markets of one", with marketing and sales aligned and messaging personalized per account, instead of generating leads in bulk. It inverts the funnel: it starts from the right accounts, defined by the ICP, and concentrates every effort on them. It fits a narrow ICP and high deal sizes, and is measured by account engagement and revenue, not by lead volume.

Lead scoring
Lead scoring is the practice of assigning points to each lead based on fit (how well they match the ideal customer profile) and engagement (the actions, product usage and interactions they show). The score ranks the queue and separates hot, warm and cold leads, so sales contacts the highest-probability deals first. Done well, it improves MQL-to-SQL conversion and must be calibrated against data on who actually becomes a customer.

Proof of concept (POC)
A proof of concept (POC) is a guided, scoped test that proves, before the contract, that the product delivers the promised value in the customer real environment. Common in enterprise sales and at the end of the cycle, a good POC has clear success criteria and a short timeframe. Without scope it becomes an endless trial that stalls the deal, and it differs from a self-serve free trial precisely by the sales guidance behind it.
Strategy and SaaS model
Business model and strategy concepts behind a SaaS.

SaaS
SaaS (Software as a Service) is the model where software is delivered over the cloud and billed by recurring subscription, instead of sold as a one-time installed license. It is multi-tenant, meaning a single codebase serves many customers, and it updates continuously. This model turns one-off sales into recurring revenue and is what makes metrics like MRR, churn and NRR central.

MicroSaaS
MicroSaaS is a lean, niche software as a service, run by a very small team, often a single person, and almost always bootstrapped. It trades massive scale for focus: it solves one specific, well-defined problem, with high margins and low fixed costs. Success depends on a niche with real pain, a clear ICP and a product that is simple to maintain.

Bootstrapping
Bootstrapping is growing a company with your own resources and revenue from customers, without raising outside capital from funds or angel investors. It trades speed for control: there is no dilution, decisions stay with the founders and cash discipline is higher. It requires reaching healthy unit economics early, because the runway is your own revenue.

Moat
A moat (competitive moat) is the structural advantage that protects a company from being copied and sustains its margins over time. In SaaS, the most common types are network effects, switching costs, brand, scale and proprietary data. A wide moat shows up in the metrics as high retention and strong NRR.

Network effects
Network effects happen when each new user increases the value of the product for everyone else, creating a loop where more value attracts more users who generate even more value. They can be direct, when users interact on the same network, or indirect, when one side of the market attracts the other. They are one of the strongest moats a SaaS can have, because they get harder to copy as the network grows.

ARR per employee
ARR per employee is ARR divided by the number of employees. It measures the capital efficiency and productivity of a SaaS: how much recurring revenue each person sustains. It rises as the company scales and automates, and it is one of the health signals investors watch alongside the Rule of 40.

MVP
An MVP (Minimum Viable Product) is the smallest version of a product that already delivers the core value and lets you learn from real users. It is not a broken product: it is the minimum that already solves the problem and tests the main hypothesis before you invest in the full product. It is the tool that shortens the learning loop and guides the search for product-market fit.

SLA
An SLA (Service Level Agreement) is the contractual commitment between a SaaS vendor and the customer about service quality: guaranteed uptime, support response time and the penalties or credits owed if the targets are missed. It gives the customer predictability, is decisive in enterprise deals and becomes a selling point. It differs from the SLO, the internal target, and the SLI, the indicator actually measured.

Uptime
Uptime is the percentage of time a service is available and working over a period. It is usually expressed in "nines": 99% allows about 3.65 days of downtime per year, 99.9% about 8.8 hours and 99.99% about 52 minutes. It is the heart of an SLA and a direct driver of trust and retention.

White-label
White-label is a product that one company develops but another resells under its own brand, delivering it to its customers as if it were its own. It is a distribution channel: the maker gains reach and revenue through partners and agencies, while the reselling brand offers a ready-made solution without building it from scratch. The cost is less contact with the end customer and less control over the brand.

Flywheel
The flywheel, or growth flywheel, is a model in which each gain feeds the next and builds momentum that eventually spins almost on its own: happy customers drive referrals, which lower the cost of acquisition and free up revenue to reinvest in the product, which creates more happy customers. Unlike the funnel, which ends at the sale, the flywheel puts retention and referral at the center of growth.