
Growth rate: what it is and how to calculate revenue growth
By Tiago Costa · Updated on July 9, 2026

Definition
Growth rate measures how fast a SaaS revenue moves between two periods, as a percentage.
- Formula: the change divided by the starting value, times 100.
- It can be monthly (MoM), yearly (YoY) or quarterly.
- YoY smooths seasonality; compound MoM reveals acceleration or slowdown.
What growth rate is
Growth rate is the pace at which a metric moves between two periods, expressed as a percentage. In SaaS it almost always means revenue growth rate, measured on MRR or ARR, but the same calculation applies to the customer base, the number of subscriptions or any volume you track over time.
More than a standalone number, growth rate tells a story of trajectory: it shows whether the business is accelerating, holding steady or losing steam. That is why it is one of the first metrics investors look at, since it captures the company momentum in a single line.
How to calculate growth rate
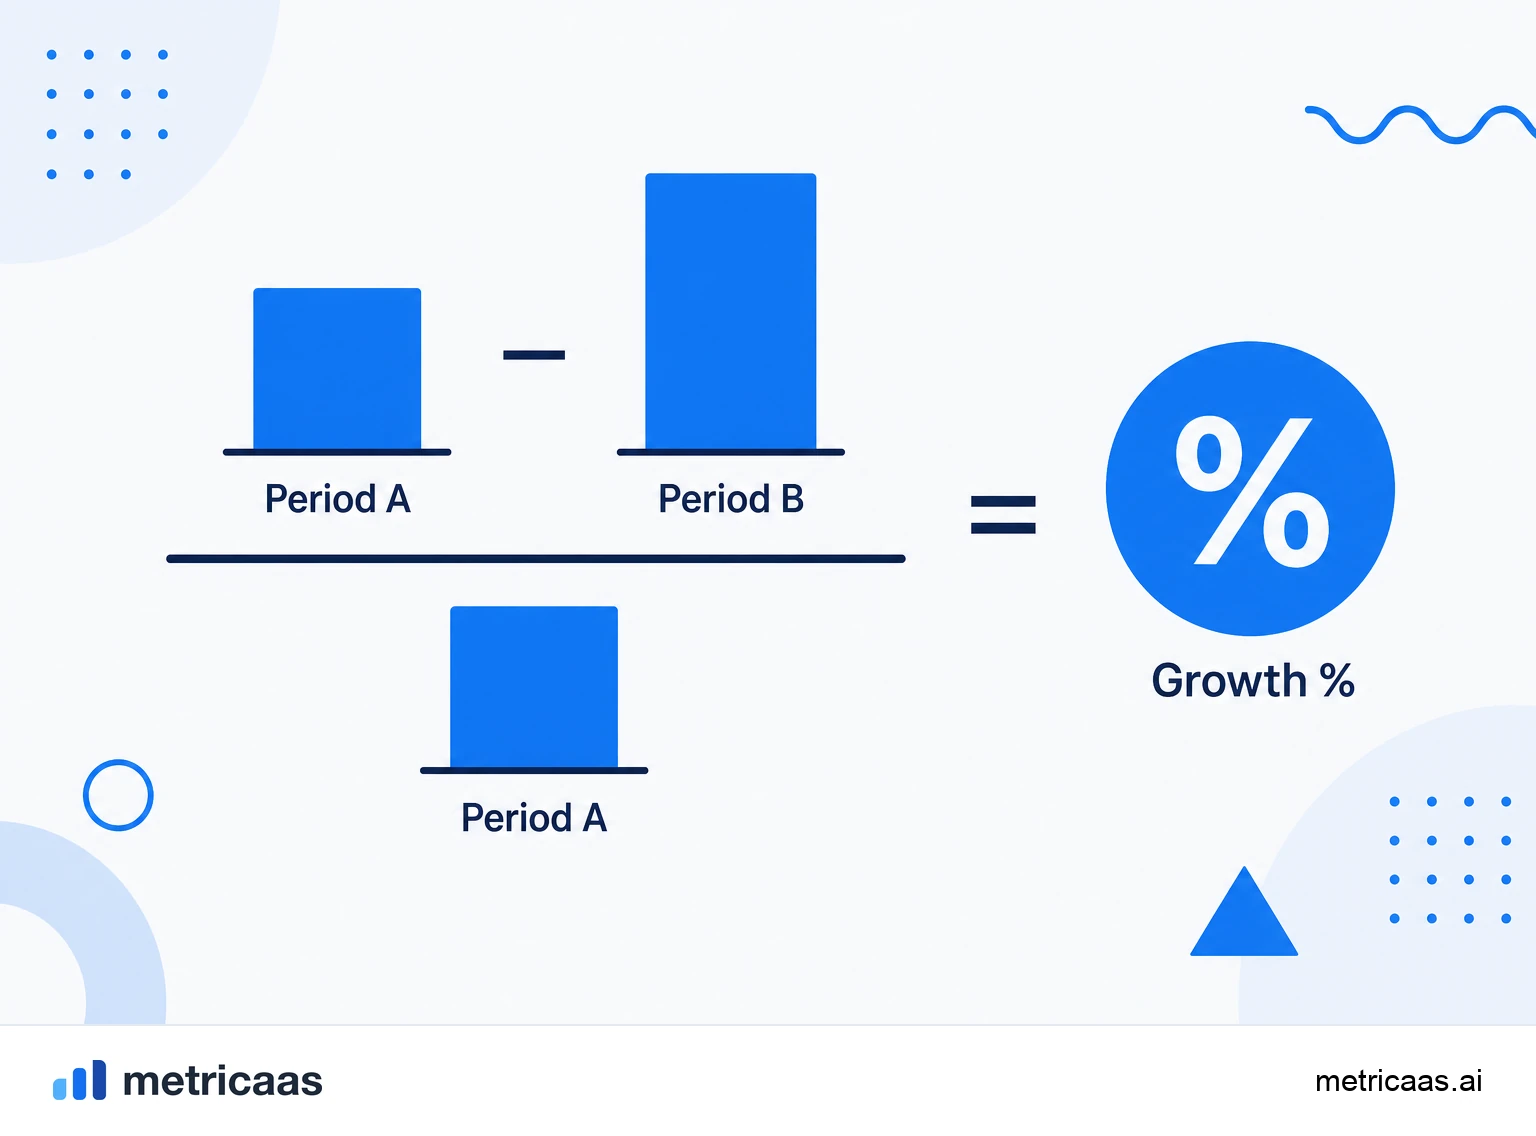
The formula is the same for any window: take the value at the end of the period, subtract the value at the start and divide by the starting value. Multiply by 100 to get the percentage.
- Growth rate = (ending value - starting value) / starting value x 100.
- Example: revenue went from $100k to $120k, so growth is (120 - 100) / 100 = 20%.
- Always use the same recurring base at both points, so you do not compare recurring revenue with one-off charges.
The denominator is the detail that trips people up. A drop from $120k to $100k is not -20% but -16.7%, because the starting point changed. Being clear about which value sits in the base avoids wrong conclusions.
MoM, YoY and quarter: which window to use
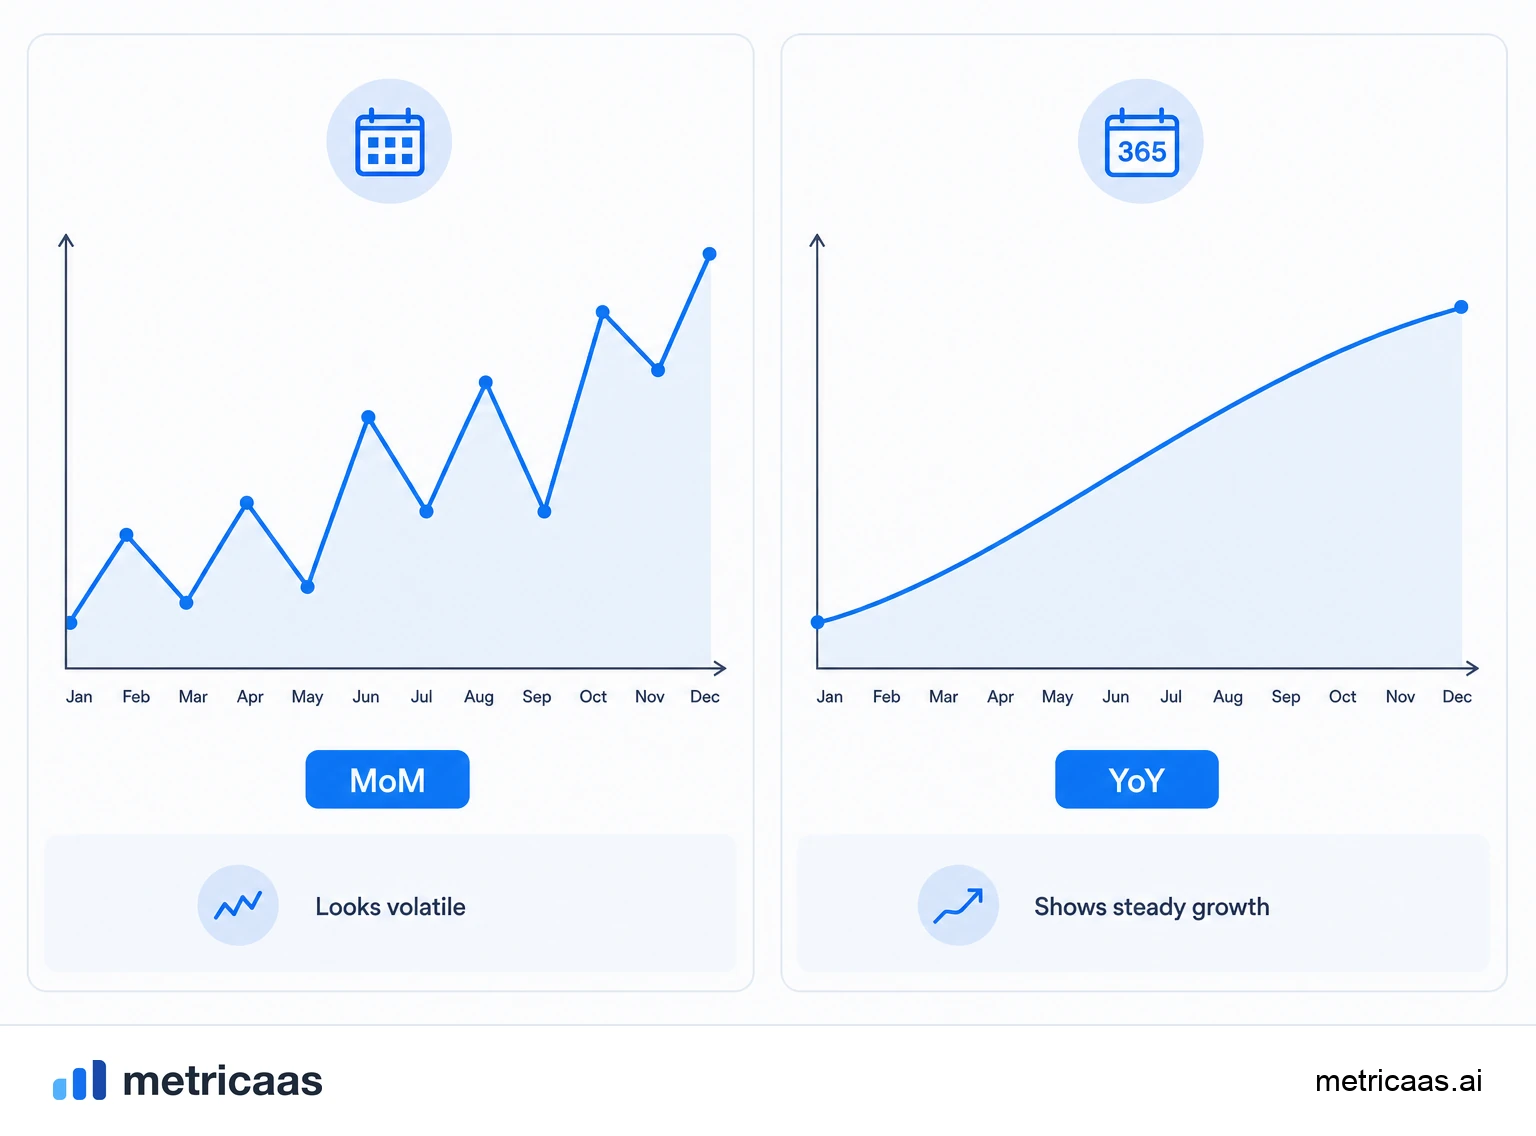
The same formula changes meaning with the window. MoM (month over month) compares one month with the previous and reacts fast, useful for self-serve products. YoY (year over year) compares the current month with the same month a year earlier and smooths seasonality. The quarterly view sits in between, common in board reports.
- MoM: sensitive and immediate, but noisy and prone to seasonality.
- YoY: stable and comparable, but slow to reveal recent shifts.
- Quarterly: a balance between reaction and stability.
The good practice is to look at more than one window at once. A strong YoY can hide three straight months of falling MoM, a sign of a slowdown that only the short window reveals.
Compound growth and CAGR
Growing 5% every month is not the same as growing 60% in a year, but closer to 80%, because growth compounds on an ever larger base. This compounding effect is the heart of SaaS growth and the reason the monthly rate matters so much.
To compare long periods, people use CAGR (compound annual growth rate), which smooths the trajectory into an equivalent average rate. A 20% CAGR means revenue grew, on average, 20% per year on a compound basis, even if some years were stronger than others. It is the standard language for talking about multi-year growth.
What a good growth rate looks like
There is no universal number: a good rate depends on the size and stage of the company. It is natural for a small SaaS to grow hundreds of percent a year, while a mature company treats 30% annual growth as an excellent result. Comparing your own rate with peers of the same size is more useful than chasing an absolute target.
An important counterpoint is the so-called Rule of 40, popularized by Bessemer Venture Partners: the sum of growth rate and profit margin should sit around 40% or more. It is a reminder that growth is not worth any cost, and that growth and profitability must be read together. The private SaaS survey by KeyBanc Capital Markets tracks these growth and efficiency patterns year after year.
What drives growth rate
Growth rate is not a switch, it is the result of forces pushing revenue up and down. On the positive side are new customers and expansion of the current base; on the negative side, churn and downgrades. Breaking growth into these MRR movements shows where it really comes from.
Retention is the quiet foundation. A base that expands more than it loses, with NRR above 100%, grows even without adding a single new customer. That is why the most consistent companies treat growth rate as a consequence of retention and expansion, not just acquisition.
Frequently asked questions
Subtract the starting value from the ending value, divide by the starting value and multiply by 100. If revenue went from $100k to $120k, growth is 20%.
Growth rate = (ending revenue - starting revenue) / starting revenue x 100. Always use the same recurring base at both points.
MoM compares one month with the previous and reacts fast; YoY compares with the same month a year earlier and smooths seasonality.
It means revenue grew, on average, 20% per year on a compound basis over the period, building on an ever larger base.
It depends on the stage: small SaaS grow hundreds of percent a year, while mature companies see 30% a year as excellent. The Rule of 40 helps read growth alongside profitability.
Related concepts

MRR
MRR (Monthly Recurring Revenue) is the monthly recurring revenue of a SaaS: the sum of all active subscriptions normalized to a month. It is the core metric of a subscription business because it shows, predictably, how much the company earns on a recurring basis each month, without counting one-off charges.

ARR
ARR (Annual Recurring Revenue) is the annual recurring revenue of a SaaS: MRR multiplied by 12. It represents how much the company earns on a recurring basis over a year, counting only active subscriptions, with no one-off charges. It is the metric of choice for companies selling annual contracts and the standard language of investors.

MRR Movements
MRR movements are the breakdown of the monthly change in MRR into its causes: new, expansion, contraction, churn and reactivation MRR. Instead of watching only the final number, you separate every dollar that came in and every dollar that left, and see why recurring revenue grew, stalled or fell. The sum of all movements is the net new MRR for the period.