
CAGR: what the compound annual growth rate is and how to calculate it
By Tiago Costa · Updated on July 9, 2026

Definition
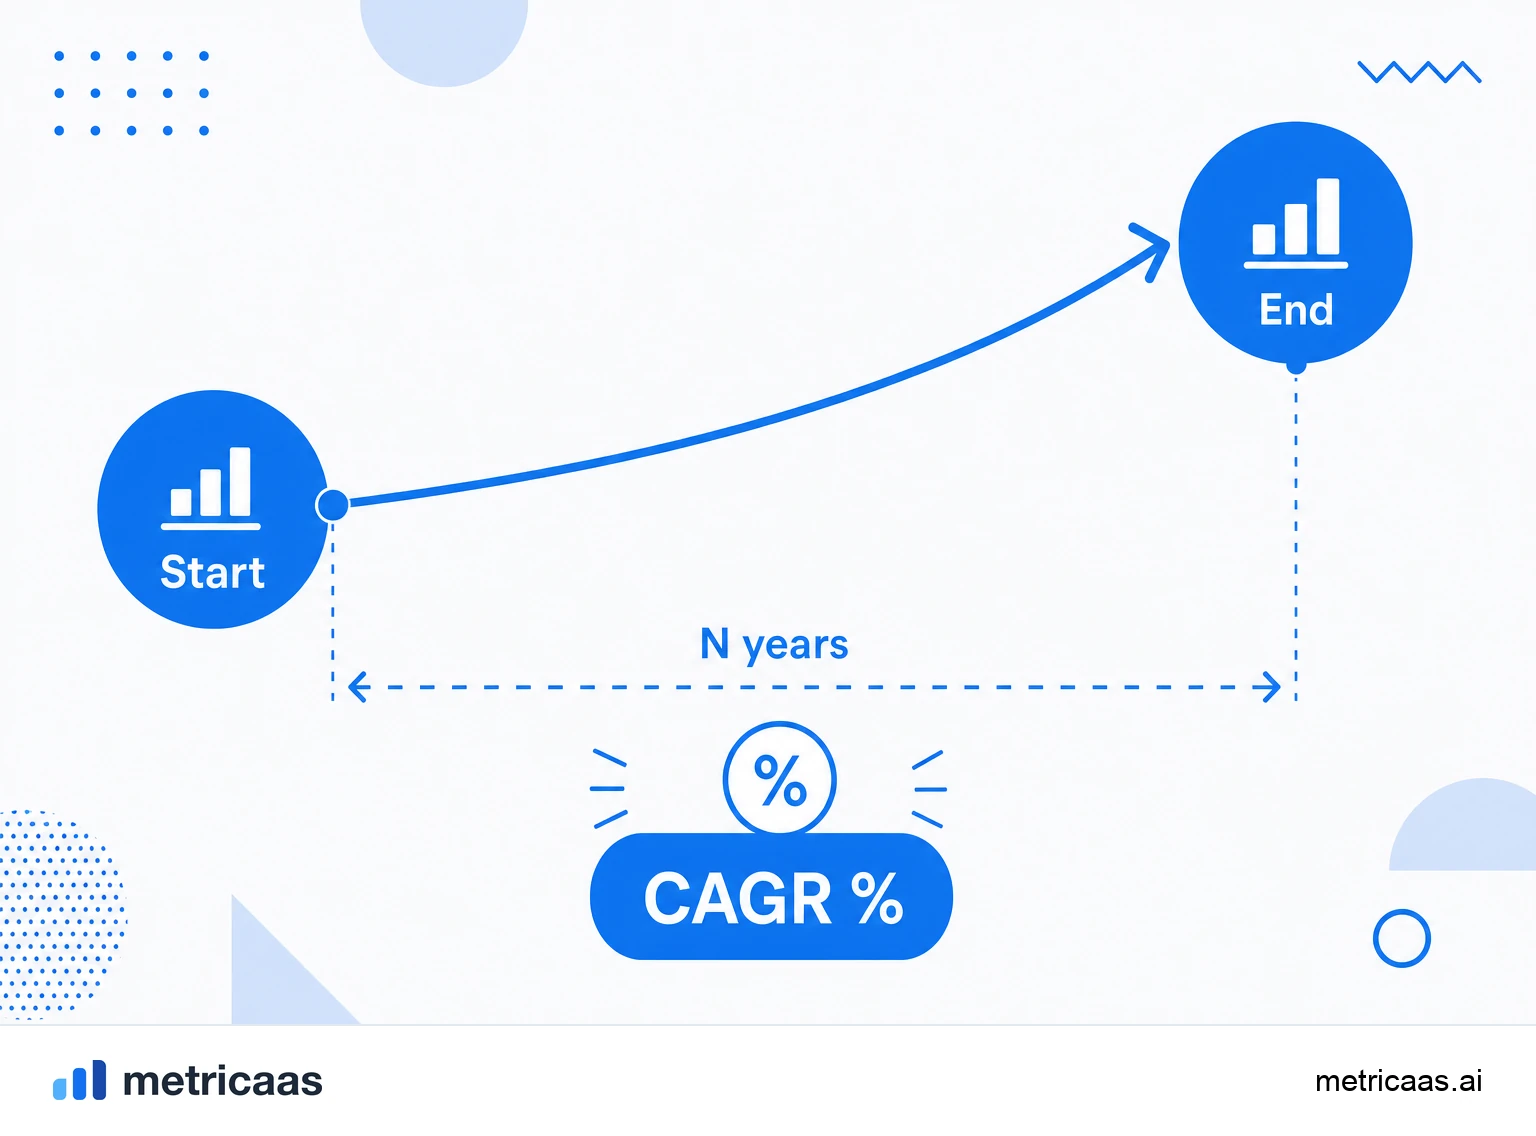
The CAGR (Compound Annual Growth Rate) is the compounded annual growth rate that takes a value from the start to the end of an N-year period.
- Formula: (ending value ÷ starting value)^(1/N) - 1.
- Smooths volatility into a single average annual rate.
- Used to compare the growth of revenue and companies across years.
What CAGR is
The CAGR, short for Compound Annual Growth Rate, answers a simple question: if a value had grown at the same rate every year, what would that rate be? Instead of showing how much revenue changed each year, it condenses the whole period into a single annual number, as if growth had been perfectly steady.
Because it is a compound rate, CAGR accounts for compounding: each year grows on top of the already larger base of the year before. That is why it describes multi-year growth better than a simple average of the yearly changes.
How to calculate CAGR
The CAGR formula needs only three inputs: the starting value, the ending value and the number of years (N) between them.
- CAGR = (ending value ÷ starting value)^(1/N) - 1.
- N is the number of years between the first and last point, not the number of points.
- The result comes out as a decimal; multiply by 100 for the percentage.
Example: if a SaaS ARR goes from $1 million to $4 million in 3 years, the CAGR is (4 ÷ 1)^(1/3) - 1, or about 58.7% per year. In other words, it is as if revenue had grown 58.7% every year, on a compound basis.
How to interpret CAGR
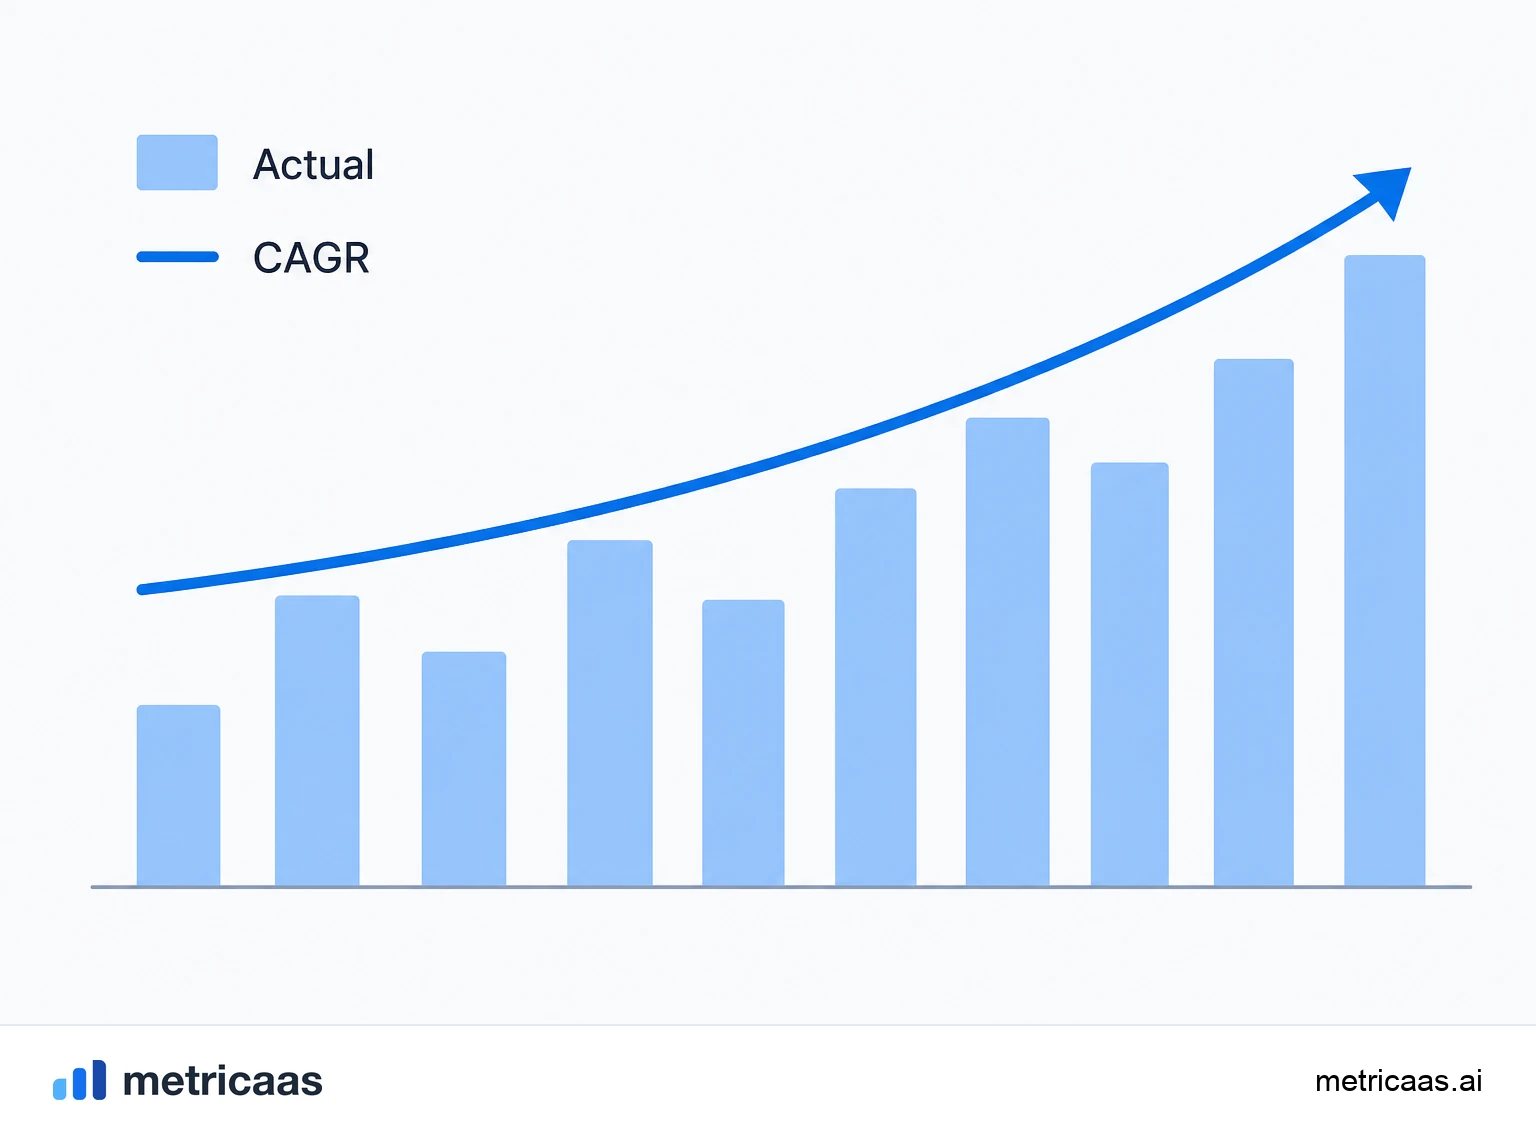
A CAGR of 15% per year means the value grew, on a compound average, 15% a year over the period. It does not mean it grew exactly 15% in each year; some years may have been stronger and others weaker. CAGR is the equivalent constant rate that would produce the same ending result.
That reading makes CAGR ideal for comparing growth across different windows and across companies. Because it is always on an annual basis, you can line up a 3-year growth against a 5-year one, or the MRR of two products, without the length of the period distorting the comparison.
CAGR versus simple growth rate
CAGR is easy to confuse with two other calculations. The simple growth rate measures only the total change over the period (from $1 to $4 is 300% in total), without telling you the annual pace. The arithmetic average of the yearly changes tends to overstate growth, because it ignores compounding and the order of the years.
- Simple growth: total for the period, with no annual basis.
- Arithmetic average: sums the yearly changes and divides by N; tends to inflate the result.
- CAGR: the equivalent compound rate that rebuilds the ending value exactly.
A classic example: a value that falls 50% one year and rises 50% the next has an arithmetic average of zero, yet it ended below where it started. CAGR captures that loss; the arithmetic average does not.
Negative CAGR and limitations
When the ending value is smaller than the starting one, CAGR turns negative: it shows the average annual rate of decline over the period. A CAGR of -8% per year, for example, reflects revenue shrinking on a compound basis, a warning sign in any recurring business.
CAGR also has limits worth knowing:
- It hides volatility: two very different paths can share the same CAGR.
- It depends on the chosen endpoints: starting or ending on an unusual year distorts the number (so-called cherry-picking).
- It assumes smooth growth that rarely exists in practice.
CAGR in SaaS growth
In SaaS, CAGR is the standard way to summarize the multi-year growth of recurring revenue. Applying it to ARR shows, in a single rate, how fast the company has been growing, which helps set targets and talk to investors, who think in multiples and in growth pace.
The context helps: according to Gartner, worldwide public cloud spending is set to reach about $723 billion in 2025, a market still growing at double-digit rates per year. In that environment, it is natural for young companies to post very high CAGRs and for the rate to moderate as the revenue base grows, which is expected and healthy.
Frequently asked questions
CAGR stands for Compound Annual Growth Rate. It is the constant average rate that, year after year and on a compound basis, takes a value from the start to the end of a period.
With the formula (ending value ÷ starting value) to the power of (1/N) minus 1, where N is the number of years. If a value goes from $1 million to $4 million in 3 years, the CAGR is about 58.7% per year.
It is the compound rate at which a company metric, such as revenue or ARR, grew per year over several years. It sums up that growth in a single, comparable annual number.
It depends on the sector and stage. In SaaS, young companies often show very high revenue CAGRs that naturally moderate as the base grows; there is no single number that fits everyone.
It is when the ending value is smaller than the starting one, indicating an average annual rate of decline. A CAGR of -8% per year, for instance, means revenue is shrinking on a compound basis.
Related concepts

ARR
ARR (Annual Recurring Revenue) is the annual recurring revenue of a SaaS: MRR multiplied by 12. It represents how much the company earns on a recurring basis over a year, counting only active subscriptions, with no one-off charges. It is the metric of choice for companies selling annual contracts and the standard language of investors.

MRR
MRR (Monthly Recurring Revenue) is the monthly recurring revenue of a SaaS: the sum of all active subscriptions normalized to a month. It is the core metric of a subscription business because it shows, predictably, how much the company earns on a recurring basis each month, without counting one-off charges.

MRR Movements
MRR movements are the breakdown of the monthly change in MRR into its causes: new, expansion, contraction, churn and reactivation MRR. Instead of watching only the final number, you separate every dollar that came in and every dollar that left, and see why recurring revenue grew, stalled or fell. The sum of all movements is the net new MRR for the period.