
Acquisition and unit economics
The cost of winning customers and the value they generate over the relationship.
13 terms

CAC
CAC (Customer Acquisition Cost) is how much, on average, you spend to win a new customer. Add up everything invested in marketing and sales over a period and divide by the number of new customers who came in during that period. It is the metric that tells you whether your growth is economically healthy.

LTV / CLV
LTV (Lifetime Value), also called CLV or CLTV, is the total value a customer generates while they stay in your base. In a simple form, it is the recurring average revenue times margin times the customer lifetime. It is the metric that shows how much it is worth investing to win and keep each customer.

CAC payback
CAC payback is the time, in months, a customer takes to return the CAC in recurring margin. Divide the CAC by the monthly gross margin each customer generates (recurring revenue per customer times gross margin). It is the metric that shows how fast the acquisition investment comes back to cash.

Payback period
The payback period is the time an investment takes to pay for itself, that is, to return in cash what it cost. In SaaS, it almost always refers to CAC payback: how many months of recurring gross margin a customer takes to recover the cost of acquiring them. The shorter the payback, the faster cash comes back and the more efficient growth is.

Cost per lead (CPL)
Cost per lead (CPL) is the marketing spend of a period divided by the number of leads generated in that period. It measures how much it costs, on average, to attract an interested contact, and it sits before CAC in the acquisition funnel. It is mainly used to compare channels, as long as you also look at the quality and conversion of the leads, not just the price.

SaaS magic number
The SaaS magic number is a sales and marketing efficiency metric. It divides the new ARR generated in a period by the sales and marketing (S&M) spend of the prior period. Above 1 is excellent and lets you accelerate investment, between 0.5 and 1 is healthy, and below 0.5 raises an efficiency warning.

Trial-to-paid conversion
Trial-to-paid conversion is the share of free trials that become paying customers: paid conversions divided by trials started. It is the central metric of self-serve products and it varies widely depending on whether the trial requires a card (opt-out, roughly 40% to 60%) or not (opt-in, roughly 10% to 25%). Activation during the trial is the strongest predictor of who converts.

Freemium conversion
Freemium conversion is the percentage of users on a permanent free plan who become paying customers. It tends to be low, typically between 2% and 5%, because free attracts many people with no intent to pay. The model pays off on volume and expansion, not on a high rate.

Activation rate
Activation rate is the share of new users who reach the product first real value (the aha moment or setup milestone) within a defined time frame. It is the bridge between acquisition and retention: those who activate tend to stay, those who do not tend to churn. That makes it one of the strongest predictors of retention and the silent bottleneck of trial conversion in SaaS.
MQL / SQL
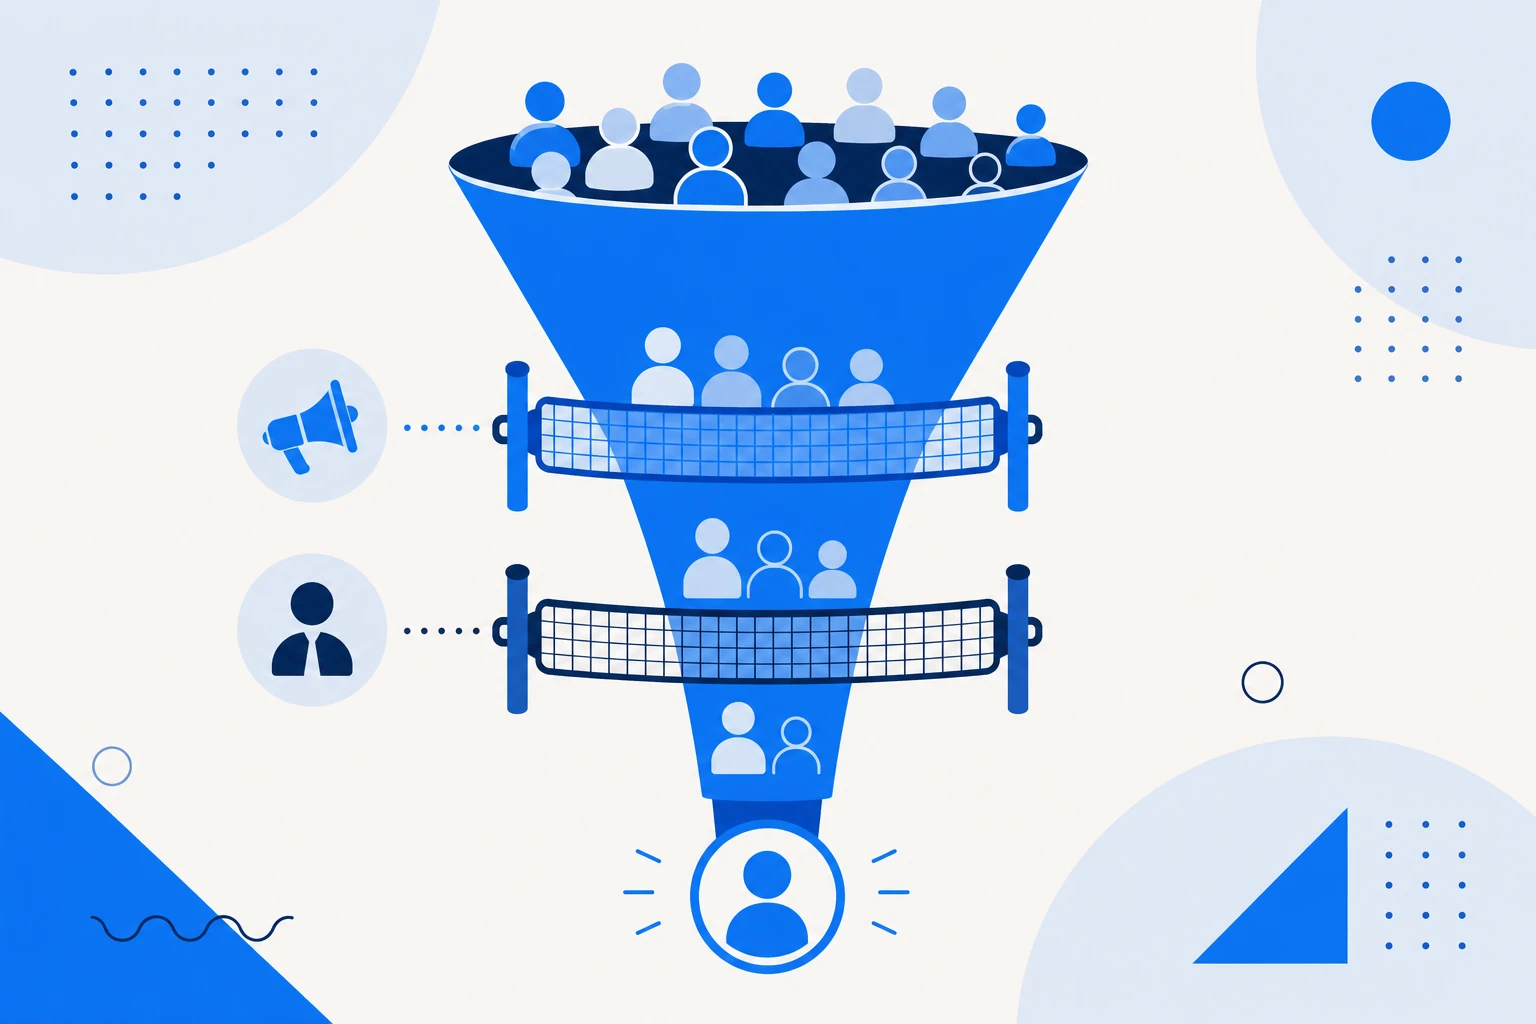
MQL (Marketing Qualified Lead) is the lead that marketing has qualified as interested enough to pass to sales; SQL (Sales Qualified Lead) is the lead that sales has validated as a real opportunity. They are successive stages of qualification in the funnel (Lead, MQL, SQL, Opportunity), and the MQL to SQL conversion rate measures alignment between the two teams.

Product Qualified Lead (PQL)
A Product Qualified Lead (PQL) is a lead qualified by product usage itself, not by marketing or sales. It is someone who reached a value milestone inside the tool, such as activating a core feature or hitting a usage limit, signaling real buying intent. It is the native lead of product-led growth and tends to convert far more than a lead qualified by profile alone.

Viral coefficient (K-factor)
The viral coefficient, or K-factor, measures how many new users each current user brings on average. It is calculated by multiplying the number of invites sent per user by the conversion rate of those invites. A K above 1 produces self-sustaining viral growth; below 1, virality only amplifies other channels rather than replacing them.

ROAS
ROAS (Return on Ad Spend) is the return on money invested in ads: the revenue a campaign generates divided by the amount spent on it. A ROAS of 4 means $4 of revenue for every $1 of ad. Unlike CAC, which sums the full cost of acquisition, and ROI, which looks at profit rather than revenue, ROAS measures only the efficiency of paid media.