
MRR movements: what they are and how to analyze them
By Tiago Costa · Updated on July 9, 2026

Definition
MRR movements are the breakdown of the monthly change in MRR into its causes.
- Five components: new, expansion, contraction, churn and reactivation.
- Their sum is the net new MRR for the period.
- They reveal whether the base grows from new sales or from expansion.
What MRR movements are
MRR movements are the breakdown of the monthly change in MRR into its causes. Instead of looking only at the final number, you separate every dollar that came in and every dollar that left, and you start to see why recurring revenue grew, stayed flat or fell.
This breakdown is what turns MRR from a scoreboard into a diagnosis. The total can rise while the company quietly loses customers, or stay flat while hiding an intense swap between gains and losses. Only by splitting the change into parts can you tell what is really happening to the base.
The five components of MRR movements
Every change in MRR over a period fits into five types of movement. Added together, they explain the difference between MRR at the start and at the end of the month:
- New MRR: recurring revenue from customers who just subscribed.
- Expansion MRR: upgrades, add-ons and increased usage from existing customers.
- Reactivation MRR: customers who started paying again after having cancelled.
- Contraction MRR: downgrades that reduce the amount paid, without a full cancellation.
- Churned MRR: revenue that disappears when a customer cancels entirely.
The first three (new, expansion, reactivation) add revenue; the last two (contraction and churn) subtract it. Expansion and churn are the most revealing: together they show whether the customer base grows or shrinks on its own, before any new sales.
The MRR waterfall chart
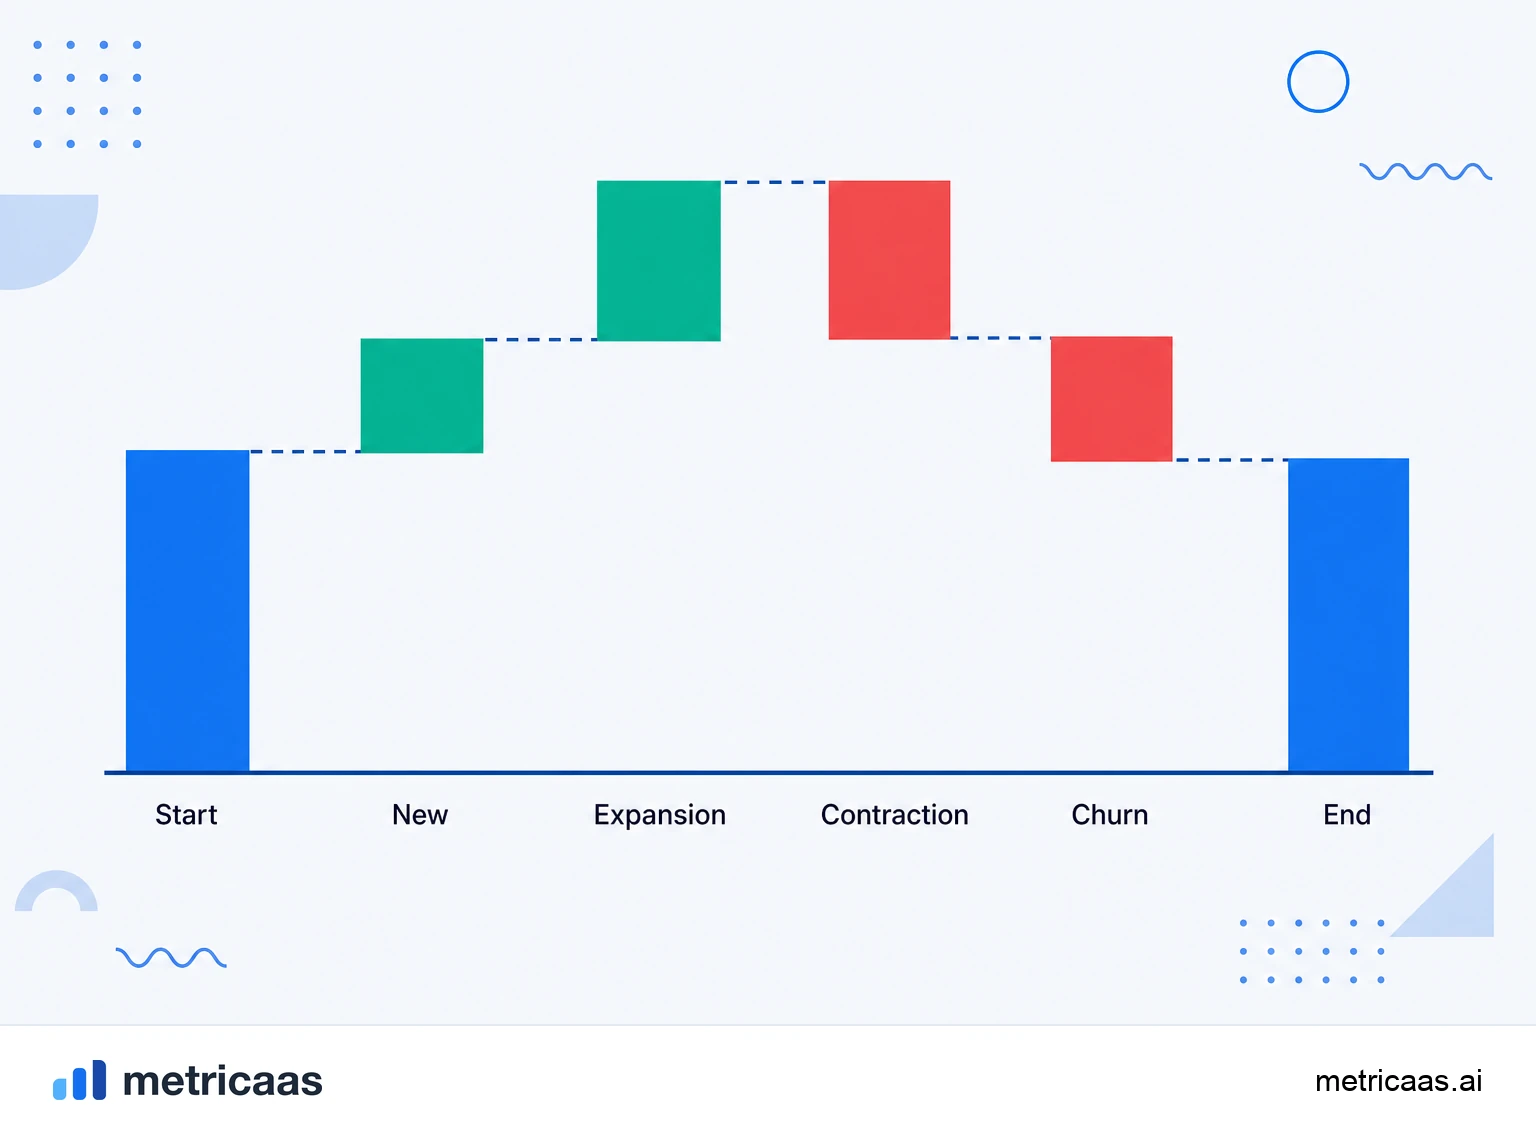
The clearest way to see the movements is the waterfall chart (or MRR bridge): it starts from MRR at the beginning of the month, stacks the additions and subtracts the losses until it reaches MRR at the end. The sum of every movement is the net new MRR for the period.
An example that adds up. A SaaS starts the month with $100k of MRR and records:
- New MRR: +$12k
- Expansion MRR: +$8k
- Reactivation MRR: +$2k
- Contraction MRR: -$3k
- Churned MRR: -$7k
The net for the month is +$12k ($22k of additions minus $10k of losses), and end-of-month MRR is $112k. It is the waterfall that shows that, despite the growth, $10k of recurring revenue slipped away along the way.
Gross new MRR and net new MRR
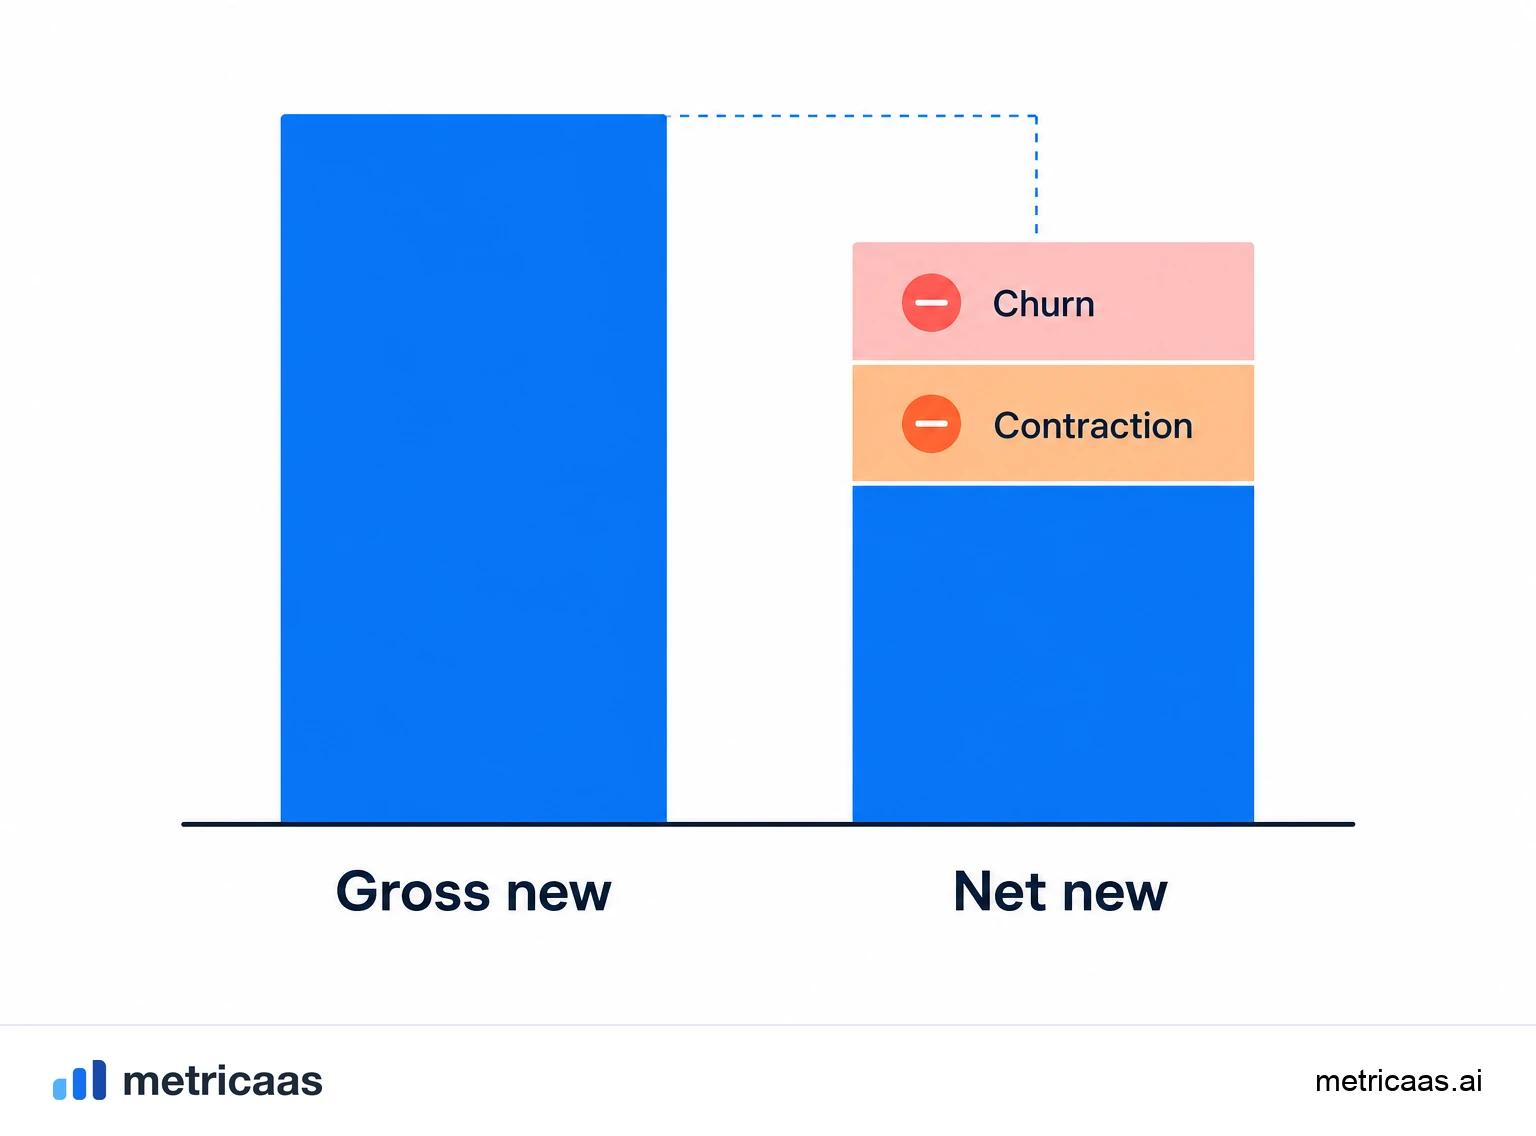
Two numbers are often confused. Gross new MRR adds up only what was gained in the period: new plus expansion plus reactivation. Net new MRR takes from that total what was lost to contraction and churn.
- Gross new MRR = new + expansion + reactivation. In the example, $22k.
- Lost MRR = contraction + churn. In the example, $10k.
- Net new MRR = gross minus lost. In the example, $12k.
The difference matters because the gross figure measures the strength of the sales machine and the ability of the product to expand accounts, while the net figure measures the real growth of the base. Watching only the net hides how much acquisition effort is being spent just to plug the hole left by losses.
Why two businesses with the same net differ
Two companies can close the month with the very same net new MRR and be in opposite situations. One grows almost entirely from new sales while losing its base to churn: it has to run faster and faster just to stay in place. The other grows from expansion of the customers it already has, with little loss, and gains scale without depending on acquisition alone.
That second situation is the signature of a healthy business, and it shows up in the industry data: the annual private SaaS survey by KeyBanc Capital Markets shows net revenue retention above 100%, meaning that on average expansion more than offsets losses. That is why Net Revenue Retention and MRR movements tell the same story from different angles: only the breakdown says whether growth comes from inside the base or from outside it.
How to track MRR movements in practice
Movements only become decisions when they are tracked closely and rebuilt from real subscription data, not from estimates. A simple routine:
- Rebuild each movement from the subscriptions and invoices in your gateway, comparing the state of each customer from one month to the next.
- Track the movements every week, not just at close, to catch a spike in contraction or churn early.
- Separate expansion from new: they call for different teams and tactics.
- Cross new MRR with CAC to know whether acquisition pays off.
When movements are rebuilt from scratch out of what actually happened to each subscription, they stop being an end-of-month report and become the dashboard that guides product, sales and retention throughout the period. They also feed ARR and the growth forecast.
Frequently asked questions
MRR movements are the breakdown of the monthly change in MRR into its causes: new, expansion, contraction, churn and reactivation. They turn the number into a diagnosis.
Five: new, expansion and reactivation MRR add revenue; contraction and churned MRR subtract it. Their sum is the net new MRR.
New MRR comes from customers who just subscribed; expansion MRR comes from upgrades and add-ons of existing customers. One measures acquisition, the other the growth of the base.
Net new MRR is gross new MRR (new + expansion + reactivation) minus what was lost to contraction and churn. It is the real change in the base over the period.
A chart that starts from the opening MRR of the month, stacks the additions and subtracts the losses until it reaches the closing MRR. The sum of the movements is the net new MRR.
Because the total hides its causes. Two companies with the same net can be in opposite situations; only the breakdown shows whether growth comes from new sales or from expansion.
Related concepts

MRR
MRR (Monthly Recurring Revenue) is the monthly recurring revenue of a SaaS: the sum of all active subscriptions normalized to a month. It is the core metric of a subscription business because it shows, predictably, how much the company earns on a recurring basis each month, without counting one-off charges.

Expansion
Expansion (expansion revenue or expansion MRR) is the additional recurring revenue that comes from customers you already have, without relying on new sales. It comes from upsell (higher plan), cross-sell (more products), add-ons and usage growth. It is the force that pushes net revenue retention above 100% and makes the base grow on its own.

Net Revenue Retention (NRR)
Net Revenue Retention (NRR) measures how much of the recurring revenue from your current base you keep over time, already accounting for upgrades and expansion, minus downgrades and cancellations. Above 100% it means the base grows on its own, even without new customers.