
Financial health and accounting
Cash, margins, profit and the accounting concepts that hold the business up.
21 terms

Gross margin
Gross margin is the share of revenue left after the direct cost of delivering the service: (revenue minus COGS) divided by revenue, as a percentage. Pure SaaS usually runs between 70% and 85% or more, and that headroom is what sustains the model, feeds LTV and funds reinvestment in growth.
COGS
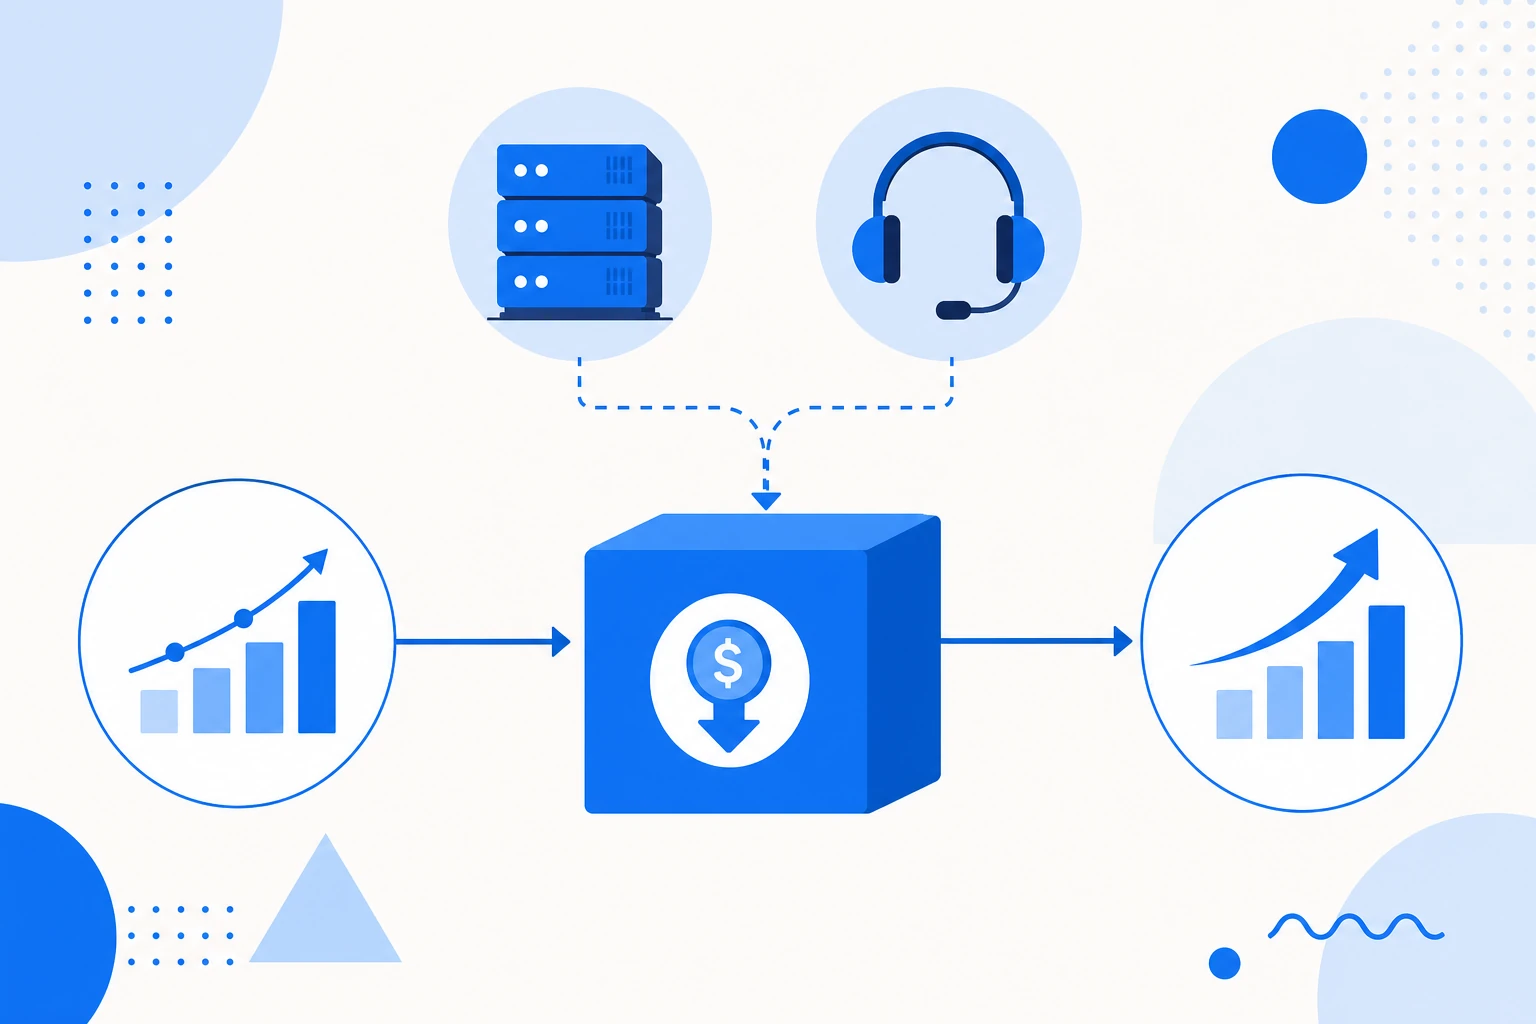
COGS (Cost of Goods Sold) is the direct cost of delivering a SaaS service: hosting and infrastructure, customer support, third-party fees and payment processing. It does not include sales, marketing or R&D, which are OpEx. It is the base of gross margin: revenue minus COGS equals gross profit.

Gross profit
Gross profit is revenue minus COGS, the direct cost of producing and delivering the product or service. It is the first profit line on the income statement, taken before operating expenses, interest and taxes. Divided by revenue, it gives the gross margin, which in SaaS tends to be high because the cost of serving each additional customer is low.

Contribution margin
Contribution margin is revenue minus variable costs, measured per unit or in total. It is what each sale leaves over to cover fixed costs and, after that, become profit. Unlike gross margin, which subtracts all of COGS, it isolates only what changes with volume, which is why it underpins break-even analysis and pricing decisions.

Operating margin
Operating margin is operating profit divided by revenue: how much of each dollar of revenue is left after paying the cost of service (COGS) and operating expenses (OPEX), before interest and taxes. It measures the profitability of the operation itself, with no effect from capital structure or taxes. In SaaS, it is the profitability component that adds to growth in the Rule of 40.
EBITDA
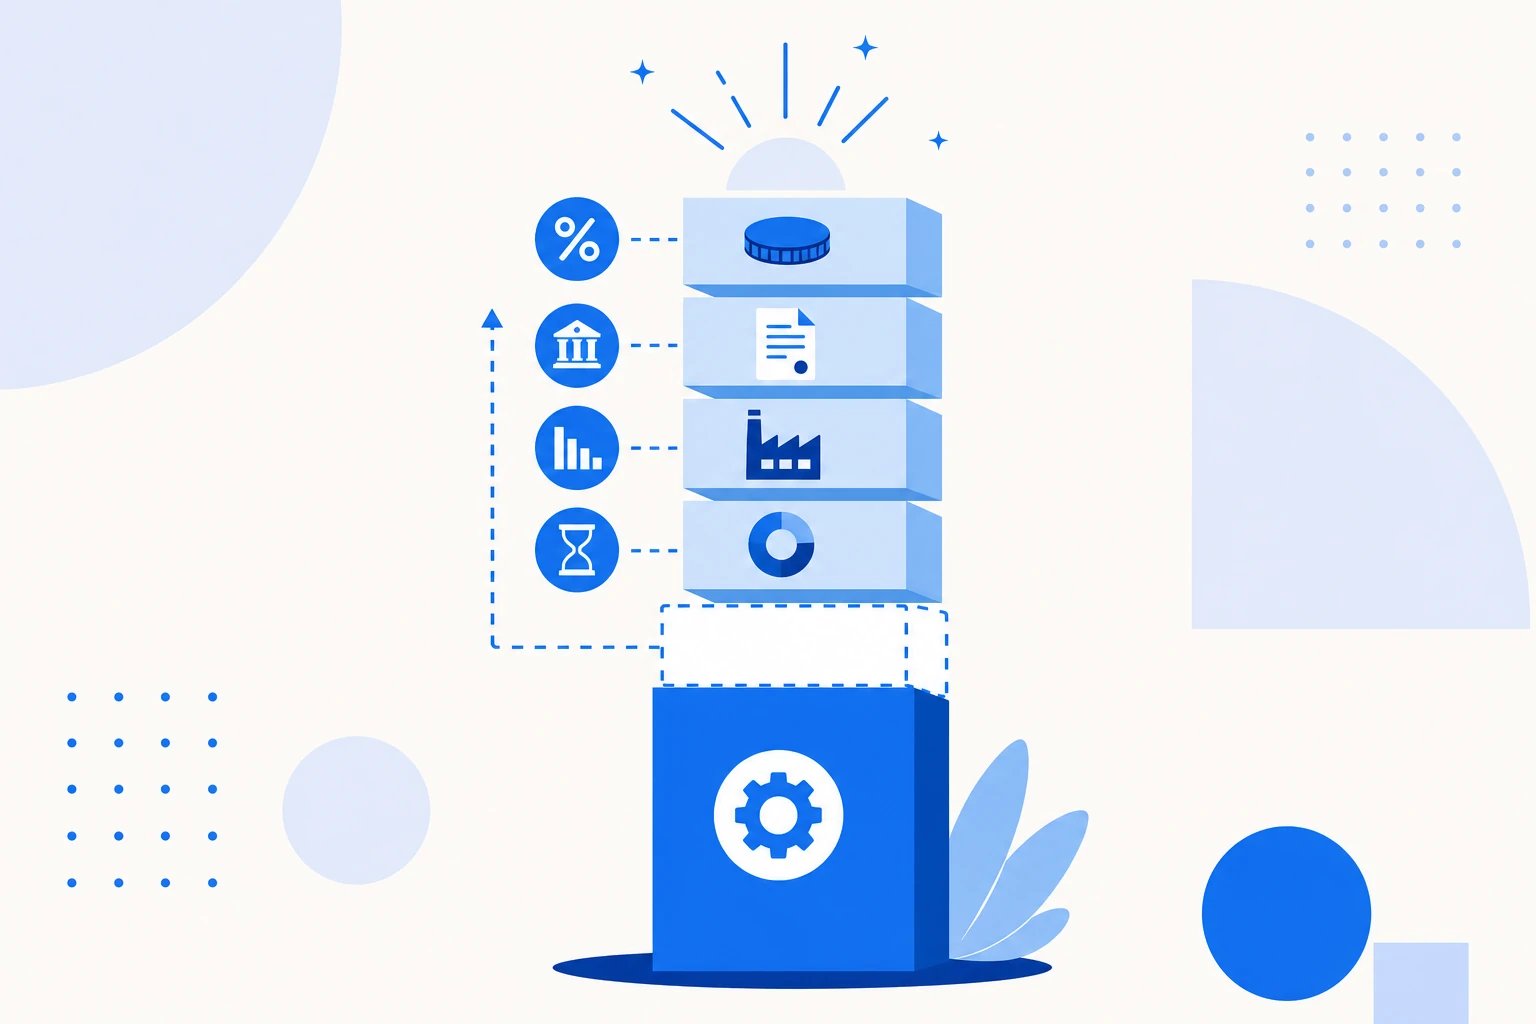
EBITDA (earnings before interest, taxes, depreciation and amortization) measures the result a company generates from its operations, before decisions about financing, taxation and how past investments are accounted for. It starts from operating profit and adds depreciation and amortization back, approximating operating cash generation and letting you compare companies with different capital structures. It is not cash flow: it ignores capex and changes in working capital.

Net income
Net income is the last line of the income statement, the so-called bottom line: what is left of revenue after subtracting all costs, operating expenses, interest and taxes. It is the final accounting profit, different from cash (because it follows accrual accounting) and from EBITDA (which excludes interest, taxes, depreciation and amortization). Many growth-stage SaaS run negative net income while reinvesting to capture market.

Break-even
Break-even is the level of revenue or units sold at which the company result is zero: revenue covers exactly all costs. In units, it equals fixed costs divided by the unit contribution margin. Above it every sale turns into profit; below it, into loss, which is why reaching it is the milestone that frees a startup from depending on external cash.

Cash flow
Cash flow is the difference between the money coming into a company and the money going out over a period. It splits into operating, investing and financing, and it is not profit: cash is what actually moves through the account. In SaaS, billing annual contracts upfront brings cash forward relative to recognized revenue.
Free cash flow
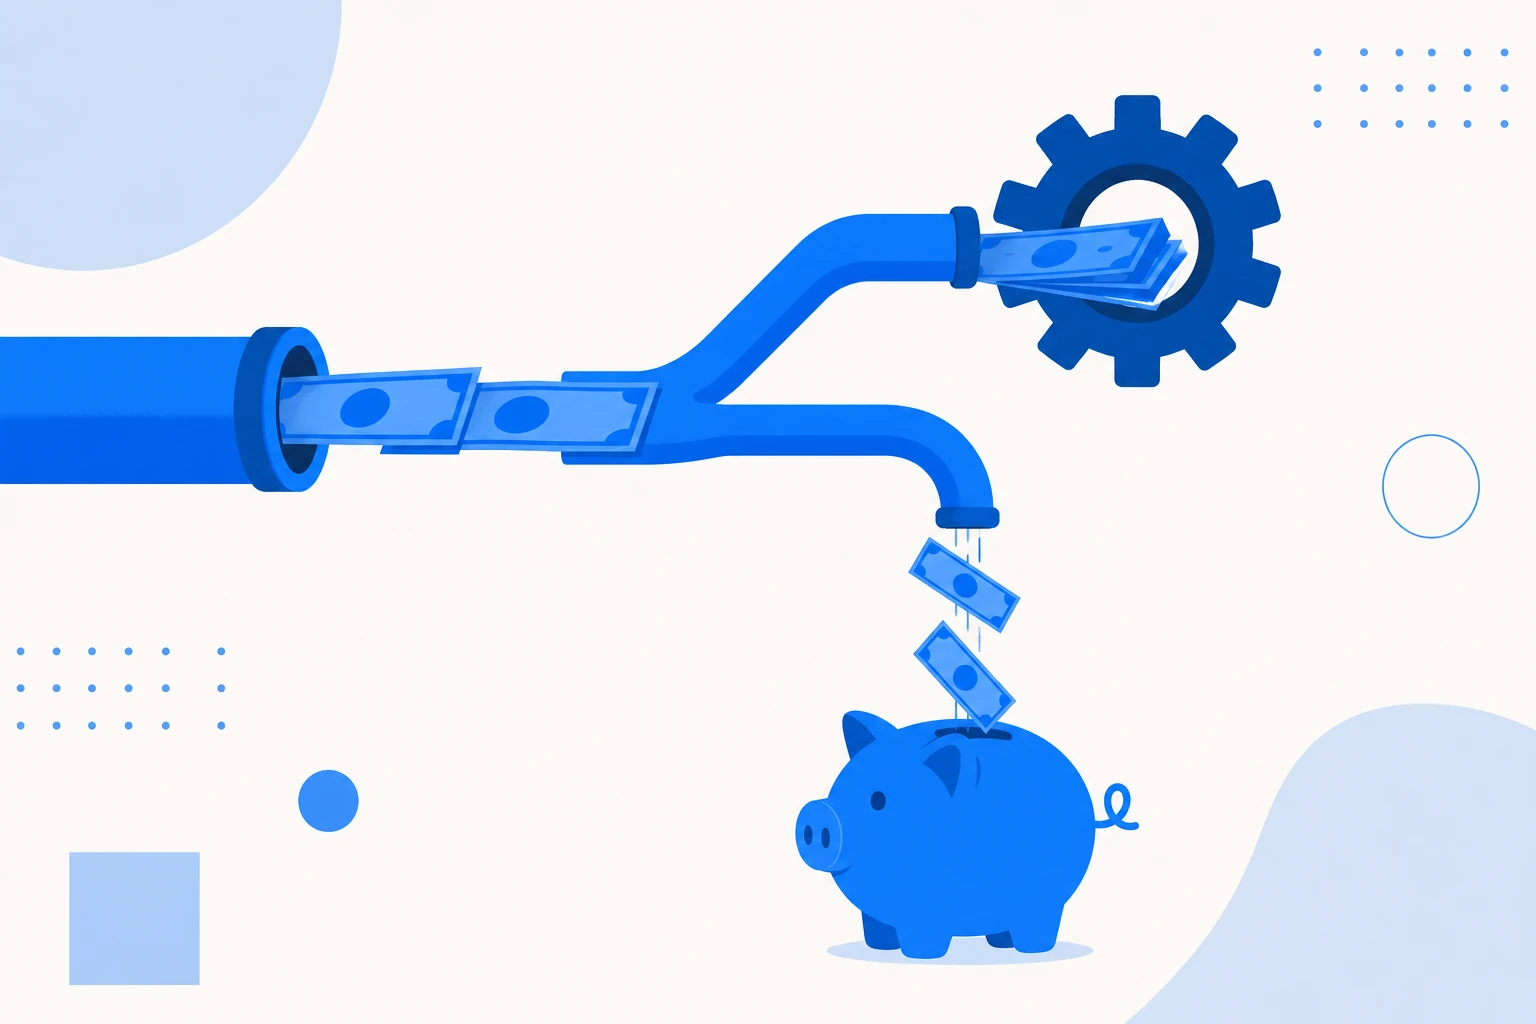
Free cash flow (FCF) is the cash left from operations after paying for capital investments (capex). It is the money truly available to pay down debt, reward investors or reinvest in growth. A SaaS that generates positive FCF funds itself and depends less on raising rounds.

Burn rate
Burn rate is the speed at which a company consumes its cash, almost always measured per month. Gross burn adds up all the money going out; net burn subtracts the revenue coming in and shows what actually drains the cash. It is the denominator of runway: the lower the burn, the more time a startup has before it needs new capital.

Runway
Runway (cash runway) is how many months a company can keep operating on the cash it has, at its current burn rate. You calculate it by dividing available cash by the monthly net burn, and it sets the urgency to raise money or reach break-even. It is the financial breathing room that buys time to get the business right.

Working capital
Working capital is current assets minus current liabilities: the short-term resources a company has to run its day-to-day operation. It shows whether receivables, cash and inventory cover the obligations coming due in the next few months. In SaaS, billing upfront and paying suppliers later can produce negative working capital, and in that model it is usually a sign of health, not of strain.

OPEX / CAPEX
OPEX (operating expenses) are the recurring day-to-day costs, such as salaries, marketing and cloud, booked as expense in the period they happen. CAPEX (capital expenditure) is money put into long-lived assets, capitalized on the balance sheet and depreciated over years. The difference changes when and how each cost shows up on the income statement and in cash flow, and modern SaaS is almost entirely OPEX.

Unit economics
Unit economics is the economics of a single unit of a SaaS, which is usually a customer or an account: how much that unit generates in revenue and margin over the whole relationship versus what it costs to acquire and serve. The central pair is LTV against CAC, with a healthy ratio above 3, plus the CAC payback period. Healthy unit economics is what lets a company grow without burning cash indefinitely.

Valuation
Valuation is the estimate of what a company is worth at a given moment. In SaaS, the most common shortcut is a multiple on ARR, and that multiple rises or falls with growth, retention and efficiency, synthesized by the Rule of 40. Valuation also sets how much equity an investor gets for their check, separating pre-money (before the check) from post-money (after).

Cap table
A cap table, or capitalization table, is the record of who owns what in a company: founders, investors and the employee option pool, always adding up to 100%. It lists shares, percentages and share classes, and it is rewritten at every funding round, when new investment dilutes the existing holders. It is the basis for negotiating valuation and the term sheet.
Dilution
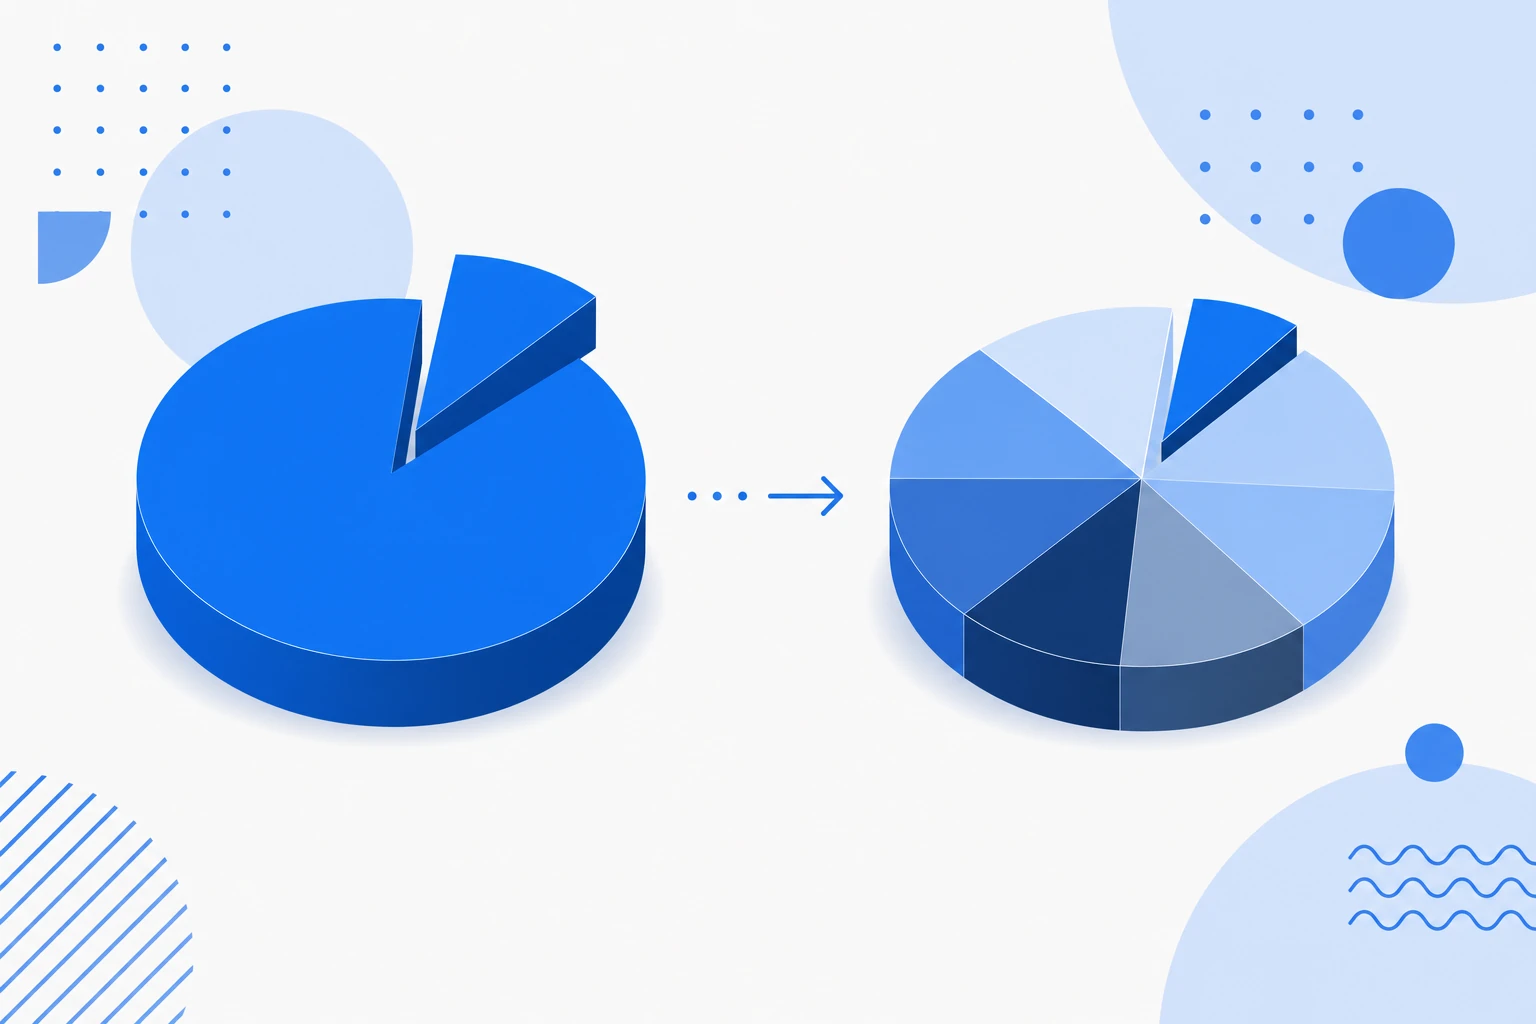
Dilution is the drop in existing owners' percentage when the company issues new shares, typically in a funding round or when creating the option pool. You end up with a smaller slice of a hopefully bigger pie. Added up across rounds, dilution defines how much founders still hold at the end.

SAFE
A SAFE (Simple Agreement for Future Equity) is the investment contract created by Y Combinator where an investor puts capital in now and converts that amount into equity at a future priced round, without setting a valuation up front. It uses a valuation cap and/or a discount to reward the risk of coming in early. It is not debt: there is no interest and no maturity date.

Term sheet
A term sheet is the mostly non-binding document that summarizes the key terms of an investment round: valuation, investment amount, ownership, liquidation preference, voting rights and governance. It is the basis for the definitive contracts and aligns expectations before due diligence. Reading beyond the valuation is essential, because the economic and control clauses weigh as much as the headline number.

Down round
A down round is a funding round raised at a lower valuation than the previous one. It signals that the market or the company performance did not hold up the old price, dilutes shareholders more, and can trigger anti-dilution provisions. Even so, it is sometimes the rational alternative to running out of cash, especially when the runway tightens and the prior valuation was stretched too far.