
Customer health score: what it is and how to calculate it
By Tiago Costa · Updated on July 9, 2026

Definition
A customer health score is a composite score that measures each customer health by combining usage, engagement, support and payment.
- Aggregates many signals into one actionable number.
- Built to act before churn, not after.
- Prioritizes the accounts with the most value at risk.
What a customer health score is
A customer health score is a composite score that estimates, in a single number, how healthy or at risk each customer is. It combines signals of product usage, engagement, support and payment to answer a practical question: is this customer likely to renew and grow, or to cancel?
Unlike looking at one isolated metric, the health score rolls several signals into one reading, which lets you act before churn instead of after the account has already asked to leave. It is a tool for anticipation, not autopsy.
How to calculate a customer health score
There is no universal formula, only a method. Pick the signals that best predict retention in your product, assign a weight to each, normalize everything to the same scale and add it up. The result usually becomes a simple band, such as green, yellow and red.
- Select 4 to 8 signals that genuinely anticipate renewal or cancellation.
- Give each signal a weight by importance, summing to 100%.
- Normalize each signal to a score (for example, 0 to 100) before weighting.
- Add the weighted scores and translate the total into a health band.
Simplified example: if product usage weighs 40%, engagement 30%, support 20% and payment 10%, a customer scoring high on usage and engagement trends green even with one open support ticket.
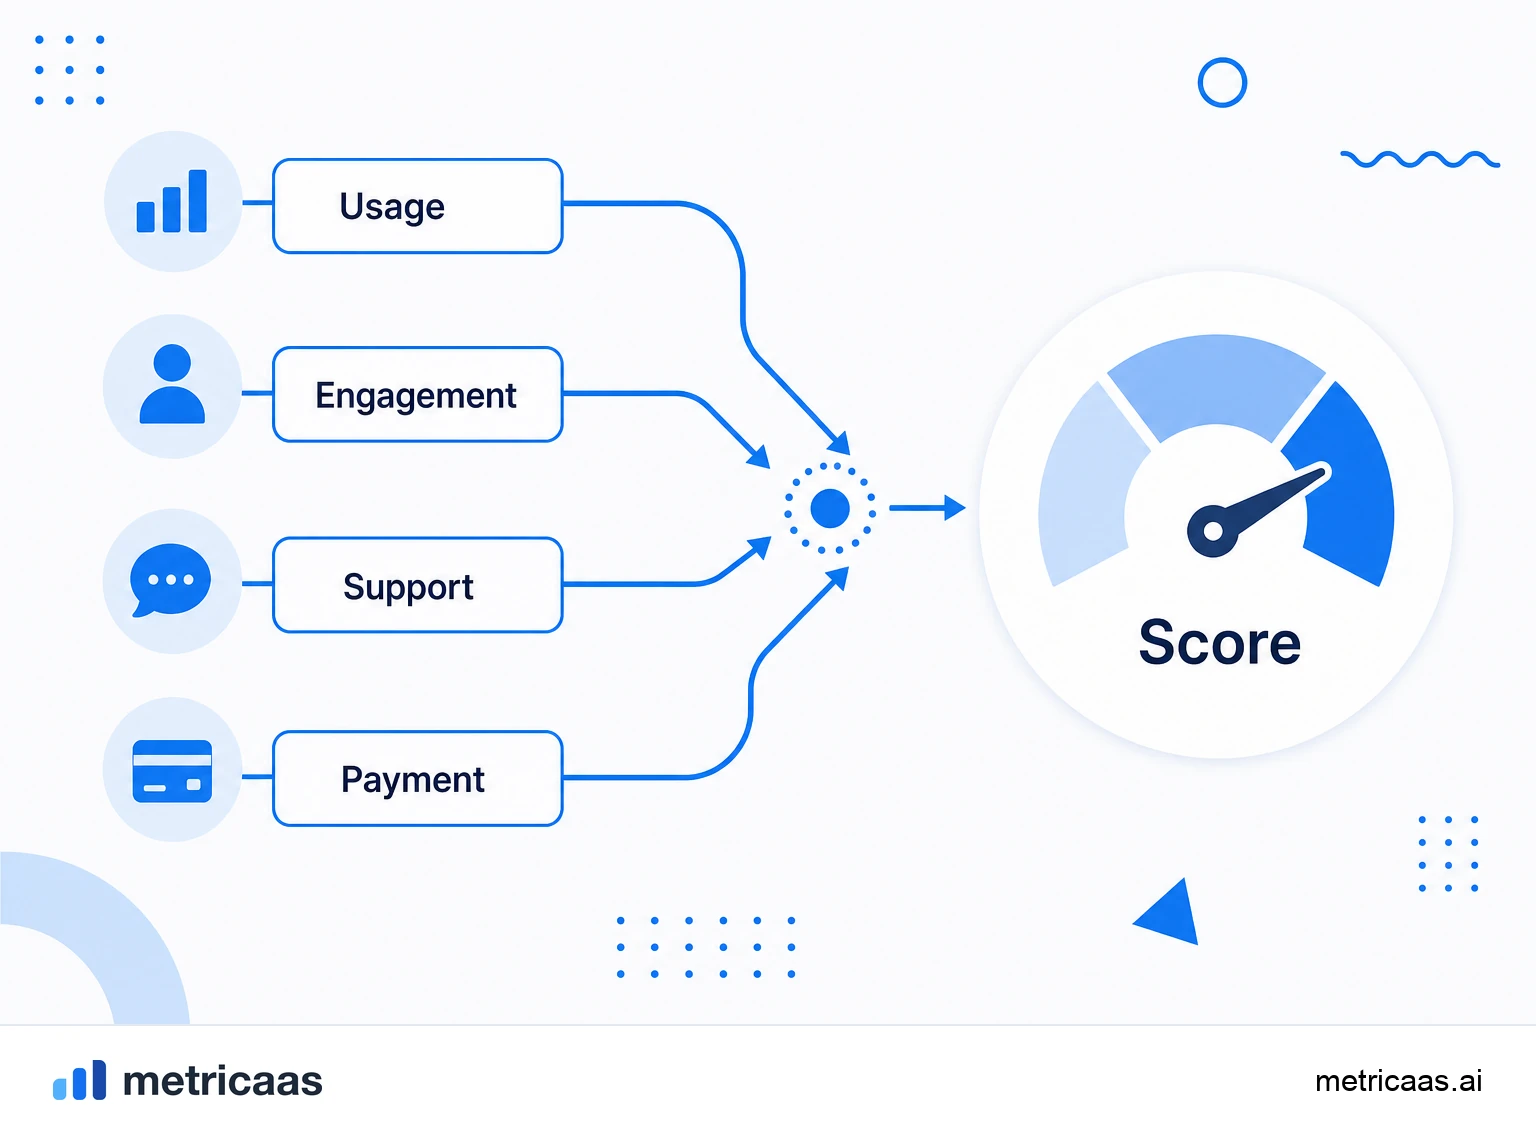
The signals that make up the score
The quality of a health score depends on the signals chosen. Good signals are objective, refreshed often and correlated with the customer staying. It pays to combine behavioral data with declared data.
- Product usage: login frequency, adoption of key features, depth of use.
- Engagement: email responses, training attendance, use of new releases.
- Support: volume and severity of tickets, resolution time, recurring complaints.
- Payment: punctuality, failed charges, downgrade requests.
- Relationship: NPS, CSAT, strength of the internal champion.
The classic mistake is stuffing the score with signals that are easy to measure but predict nothing. A few well-chosen signals beat many noisy ones.
Models: from rules to predictive
There are two broad ways to build the score. The rules-based model uses weights set by experts, is transparent and easy to explain, and works well when the team already knows the risk patterns. The predictive model uses historical data to learn which signals actually anticipated cancellations.
In practice, many teams start simple, with rules, and evolve into predictive models as they accumulate churn history to train on. What matters is not sophistication but calibration: a score that does not match the reality of renewals should be revised, not defended.
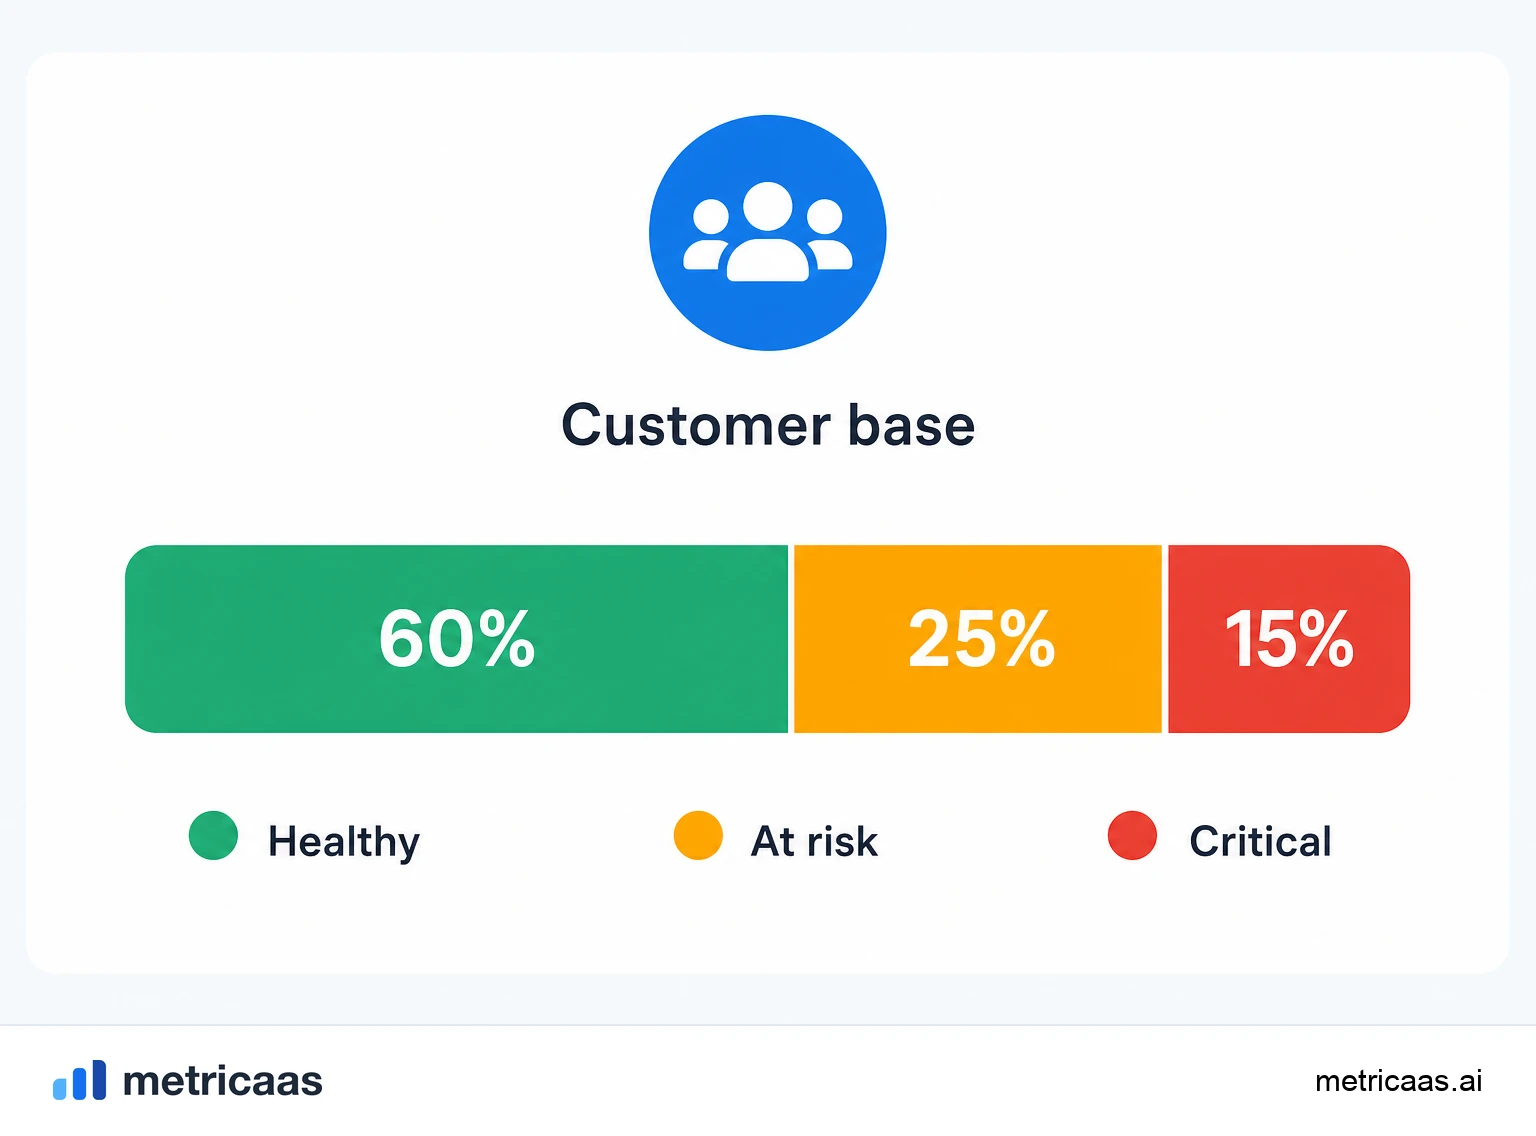
From score to action: playbooks
A health score is only worth it if it triggers action. Each band should have a playbook: red accounts enter a rescue flow, green accounts become expansion candidates, and yellow ones get preventive attention before they get worse.
- Red: alert the CS team, diagnose the cause and build a recovery plan.
- Yellow: proactive check-in and a push on adoption of key features.
- Green: the moment to propose an upgrade, new modules or seat expansion.
Prioritizing by value at risk multiplies the payoff: a red account with high LTV deserves more immediate effort than ten small accounts in the same band. The score points to the risk; the value points to the order of attack.
Why the health score sustains retention
Retaining is cheaper than acquiring, and the health score is what turns retention into a process instead of luck. It anticipates churn, guides expansion and, combining both effects, sustains NRR, the metric investors watch most closely in SaaS.
The context raises the stakes: Gartner forecasts worldwide public cloud spending to approach $723 billion in 2025, a market where the gap between growing and stalling increasingly sits in the installed base. Research by SaaS Capital shows retention is one of the strongest separators between healthy SaaS companies and those that struggle, and a well-calibrated health score is the instrument that puts that retention under control.
Frequently asked questions
A composite score that estimates how healthy or at risk each customer is, combining usage, engagement, support and payment signals into one number to act before churn.
Pick 4 to 8 signals that predict retention, weight each by importance to 100%, normalize them to the same scale, add the weighted scores and map the total to a green, yellow or red band.
Normalize each signal to a score, multiply by its weight and sum. For example, usage 40%, engagement 30%, support 20% and payment 10% produce one weighted total that becomes a health band.
There is no universal cutoff. A good score is one that matches reality, where green accounts renew and expand and red accounts churn. Calibrate the thresholds against your own renewal history.
Usually product usage, engagement, support activity and payment behavior, often complemented by NPS or CSAT. A few well-chosen signals beat many that predict nothing.
Related concepts

Churn
Churn is the loss of customers or revenue in a period. In a SaaS, it measures how many customers cancel (customer churn) or how much recurring revenue disappears (revenue churn). It is the metric that reveals whether growth is sustainable: the higher the churn, the more new sales you need just to avoid shrinking.

Net Revenue Retention (NRR)
Net Revenue Retention (NRR) measures how much of the recurring revenue from your current base you keep over time, already accounting for upgrades and expansion, minus downgrades and cancellations. Above 100% it means the base grows on its own, even without new customers.

LTV / CLV
LTV (Lifetime Value), also called CLV or CLTV, is the total value a customer generates while they stay in your base. In a simple form, it is the recurring average revenue times margin times the customer lifetime. It is the metric that shows how much it is worth investing to win and keep each customer.