
Customer churn: what it is, how to calculate it and how to reduce it
By Tiago Costa · Updated on July 9, 2026

Definition
Customer churn is the percentage of customers that cancel in a period, counted by logos rather than by revenue.
- Counts lost accounts, not lost dollars.
- It is the mirror of the customer retention rate.
- It differs from revenue churn when leavers pay above or below the average.
What customer churn is
Customer churn, also called logo churn, measures how many customers or accounts stop being customers in a period. It counts heads, or rather logos: every company that cancels weighs the same, whether it paid a thousand or a hundred thousand a month.
That is where it splits from Churn seen broadly. Customer churn answers "how many accounts did I lose?", while other readings answer "how much revenue did I lose?". Both questions matter, but they measure different things and can tell opposite stories in the same month.
How to calculate customer churn
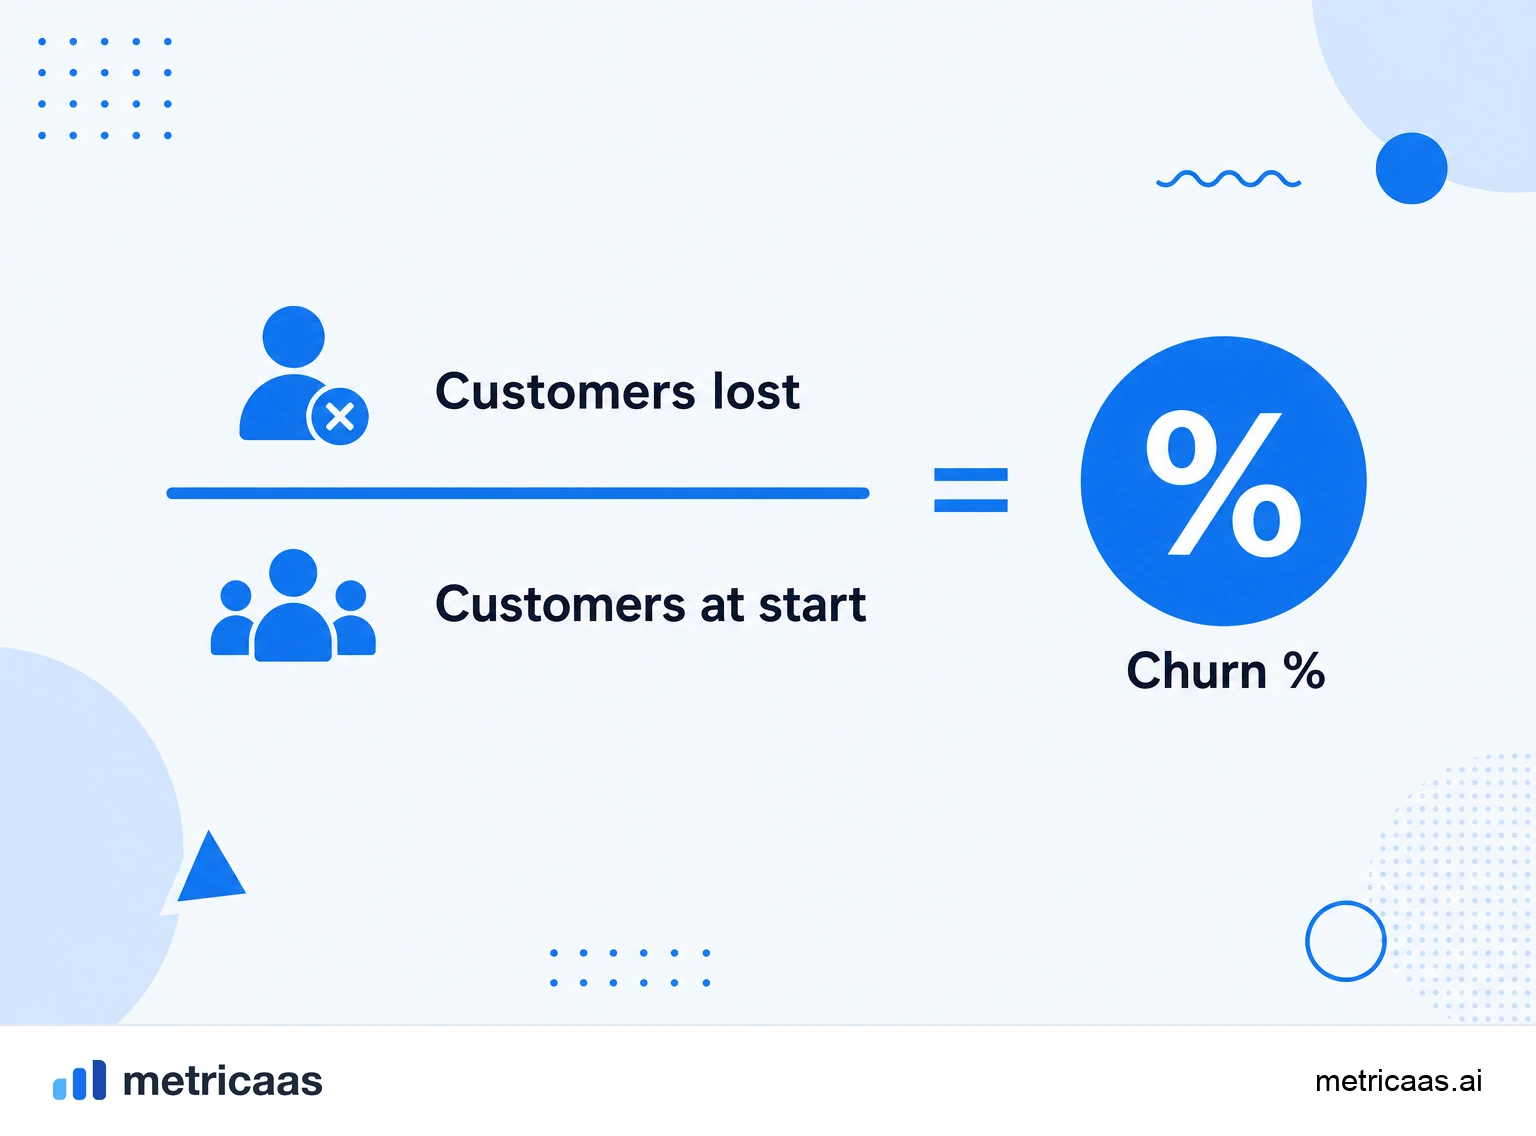
The formula is direct: divide the number of customers who cancelled in the period by the number of customers you had at the start of it.
- Customer churn = customers lost in the period / customers at the start of the period.
- Always use the base from the start of the period, so you do not mix in those who joined midway.
- Pick a fixed window (month, quarter or year) and stay consistent.
Example: if you started the month with 200 customers and 10 cancelled, customer churn for the month is 5%. It is common to report both a monthly and an annual rate; converting one into the other carelessly is one of the most frequent traps, because churn is not linear across the year.
Customer churn and revenue churn: the difference
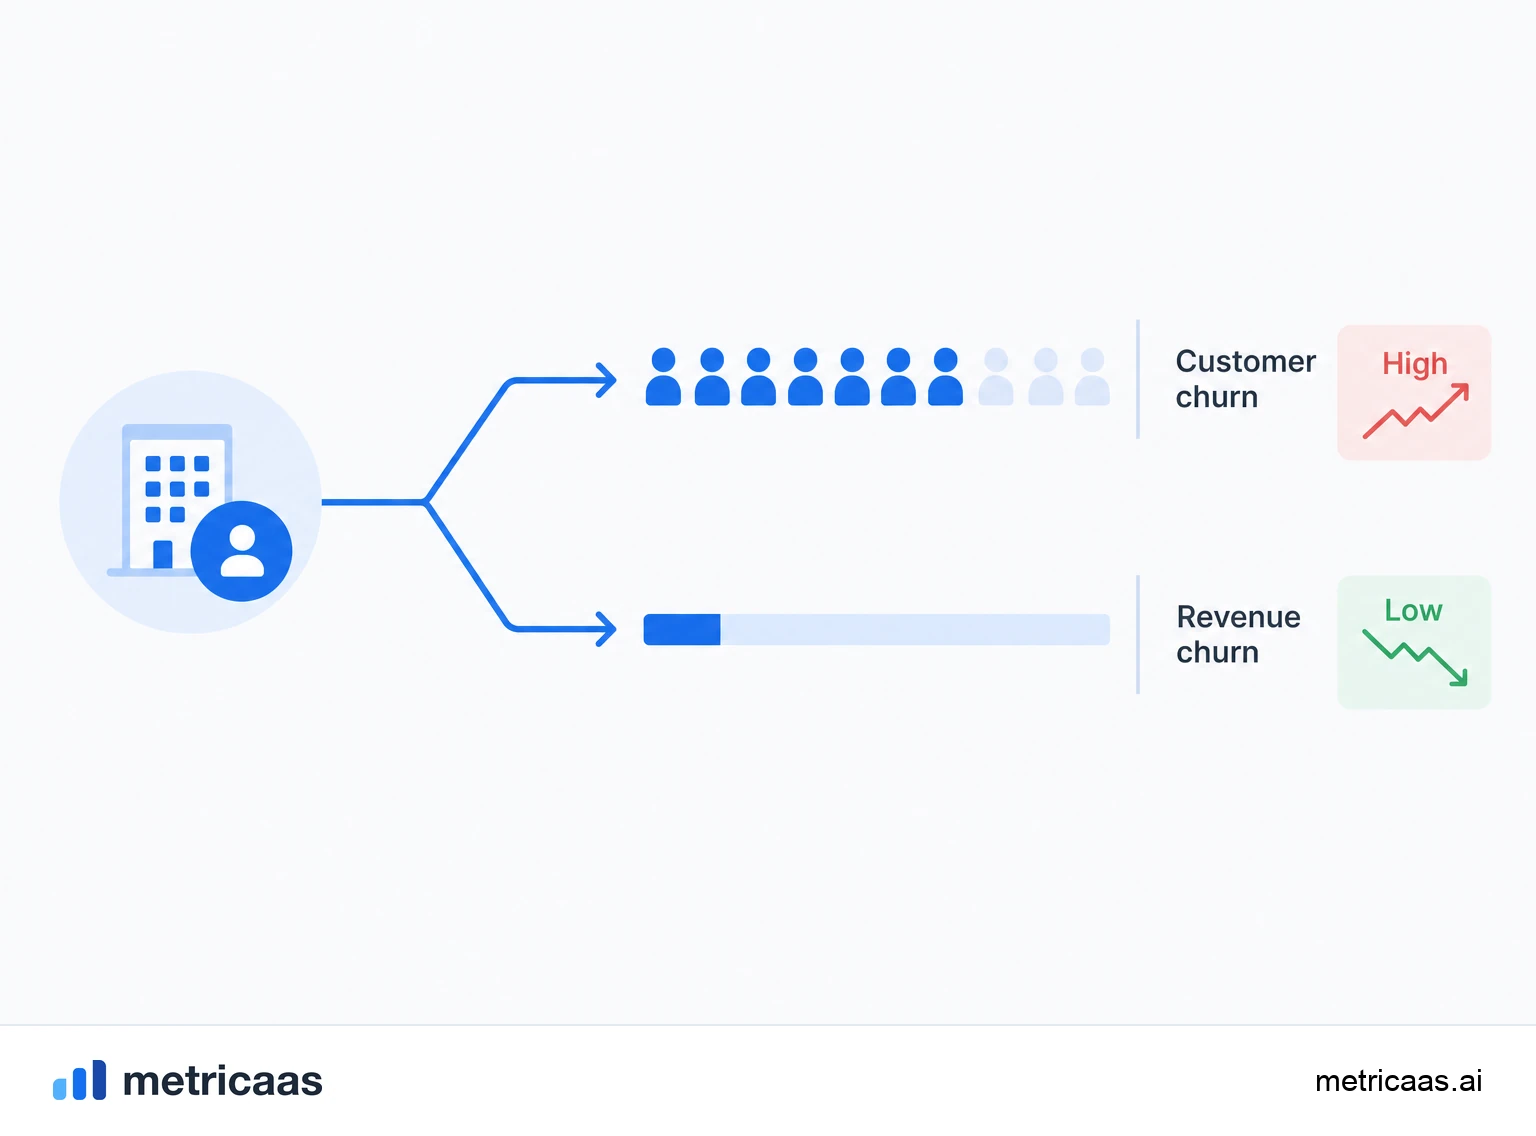
This is the distinction that trips people up the most. Customer churn counts logos; revenue churn counts lost MRR. When every customer pays the same, the two numbers match. In the real world, they diverge.
If the ones cancelling are small accounts, customer churn looks high but revenue churn stays low, because little MRR left. If the ones cancelling are large accounts, the opposite happens: a few lost logos drag down a lot of revenue. Looking at only one hides half the story, which is why mature teams track both side by side.
What a 5% or 20% churn rate means
A customer churn of 5% in a month means that, of every 100 customers you had at the start of the month, 5 cancelled. It sounds small, but 5% a month compounded is close to 46% a year: more than a third of the base evaporates in twelve months.
A 20% churn rate is a warning sign in almost any SaaS: it would mean losing a fifth of your customers in a single period. The "good" number depends on segment and deal size, but the rule always holds: monthly churn rates that look small pile up fast over the year. That is why you must read the rate together with the time horizon.
Types and causes: voluntary and involuntary churn
Customer churn usually splits into two types. Voluntary churn is when the customer chooses to leave: they saw little value, the product did not solve their problem, a competitor won them over, the budget got tight. Involuntary churn is when they leave without meaning to: a card expired, a payment failed, the charge did not go through.
- Voluntary: tackled with product, onboarding and customer success.
- Involuntary: tackled with payment recovery and retries (dunning).
Separating the two is the first step to reducing churn, because the causes and the remedies are completely different. A good share of involuntary churn is recoverable with simple billing processes.
How to reduce customer churn
Reducing customer churn is the other side of raising the retention rate and logo retention. Every point of churn you avoid is revenue you do not have to win back from scratch, and the compounding effect over time is enormous.
Benchmarks help calibrate the target. According to the research by SaaS Capital on private SaaS companies, median annual retention sits around 90%, which points to annual customer churn near 10% as a healthy reference. The private SaaS survey by KeyBanc Capital Markets confirms that the best-performing companies sustain high retention year after year. Where you land in that range depends on your segment, but the path is the same: deliver value early, watch for risk signals and act before the cancellation.
Frequently asked questions
It is the percentage of customers or accounts that cancel in a period, counted by number of logos rather than by revenue. It shows how many companies you lost, regardless of how much each one paid.
Divide the customers who cancelled in the period by the customers you had at the start of it. If you had 200 customers and 10 left, customer churn is 5%.
That 5 of every 100 customers from the start of the period cancelled. It sounds small, but 5% a month compounded is close to 46% a year.
Customer churn counts logos; revenue churn counts lost MRR. They diverge when the ones cancelling pay above or below the average deal.
It depends on segment and deal size, but private SaaS benchmarks point to annual retention near 90%, meaning annual customer churn around 10% as a healthy reference.
Related concepts

Churn
Churn is the loss of customers or revenue in a period. In a SaaS, it measures how many customers cancel (customer churn) or how much recurring revenue disappears (revenue churn). It is the metric that reveals whether growth is sustainable: the higher the churn, the more new sales you need just to avoid shrinking.

Retention rate
The retention rate is the percentage of customers or revenue that stays active at the end of a period. It is the direct complement of churn: if the annual customer churn rate is 8%, customer retention is 92%. It measures the loyalty of the base and helps forecast future recurring revenue.

MRR
MRR (Monthly Recurring Revenue) is the monthly recurring revenue of a SaaS: the sum of all active subscriptions normalized to a month. It is the core metric of a subscription business because it shows, predictably, how much the company earns on a recurring basis each month, without counting one-off charges.