
DAU / MAU: what they are, how to calculate the ratio and what stickiness is
By Tiago Costa · Updated on July 9, 2026

Definition
DAU / MAU are the daily active users (DAU) and monthly active users (MAU); the ratio between them measures stickiness, that is, how habit-forming the product is.
- DAU/MAU = average DAU divided by MAU, expressed as a percentage.
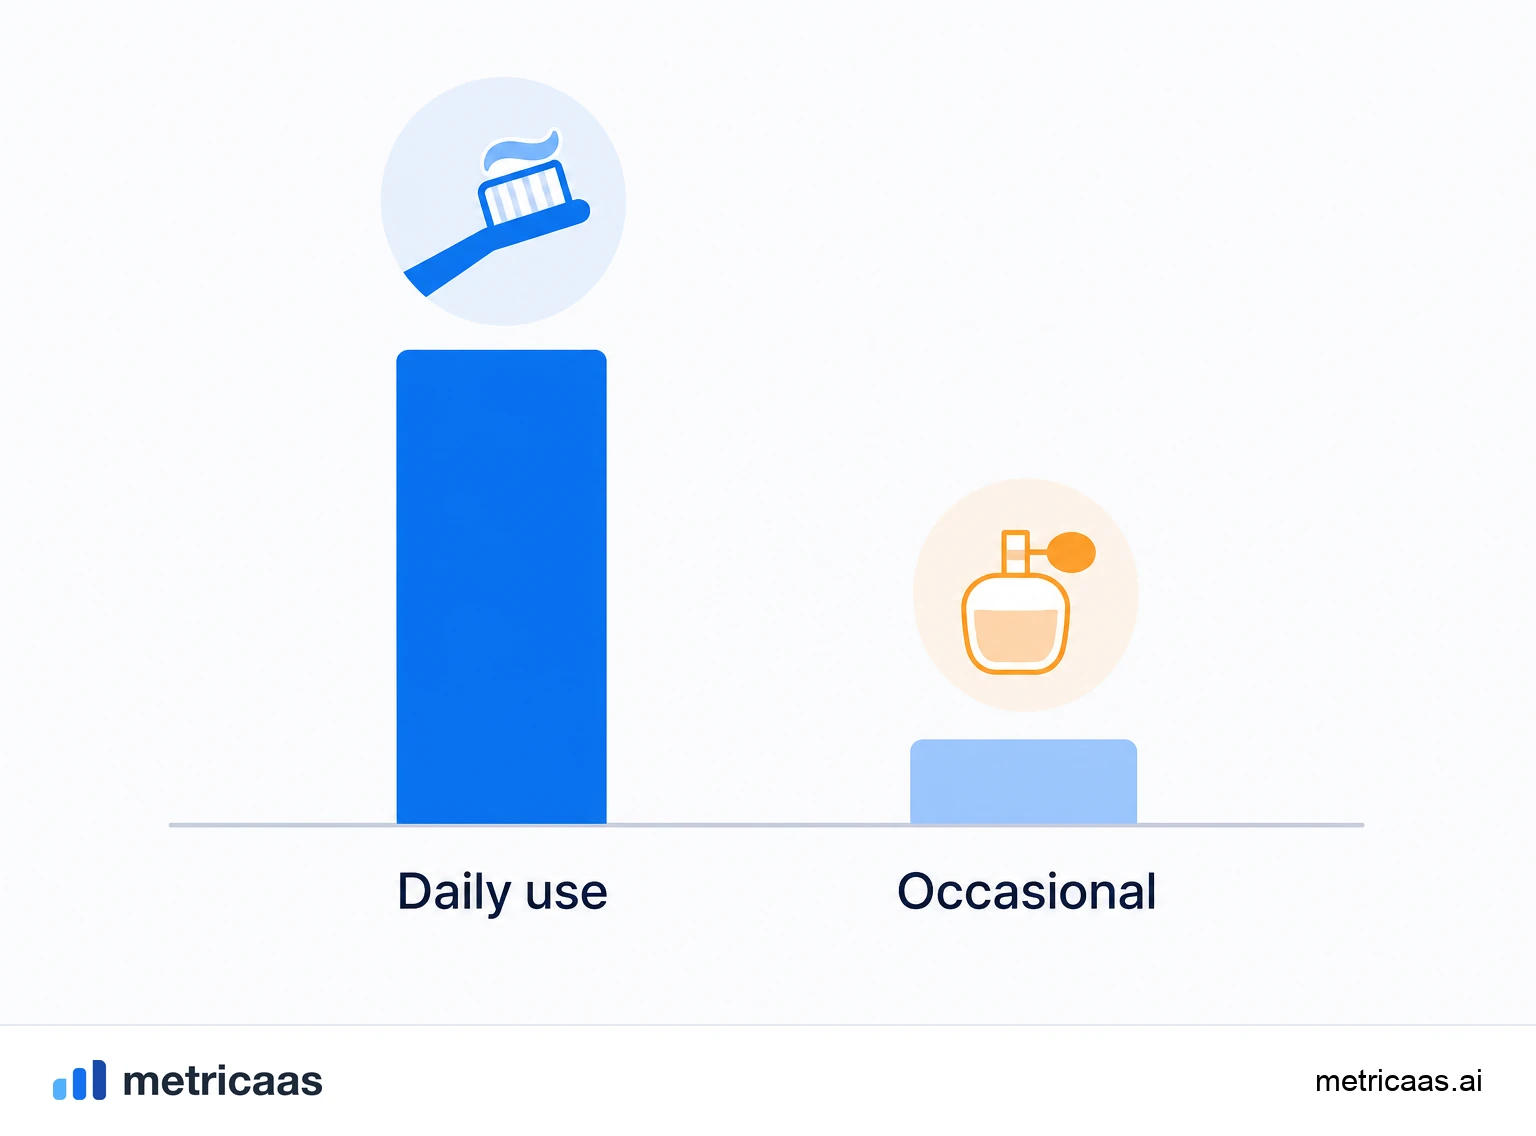
- Near 50% indicates a daily habit; low indicates occasional use.
- It is only reliable if the definition of "active" is consistent and honest.
What DAU and MAU are
DAU (Daily Active Users) is the count of unique users who took a relevant action in the product on a single day. MAU (Monthly Active Users) is the same count of unique users, but over a thirty-day window. Both measure people, not sessions or clicks: someone who opens the app five times in the same day counts once in that day DAU.
On their own, these counts speak of reach, not intensity. MAU tends to grow with marketing and acquisition, because the user only has to show up once in the month to be counted. DAU is harder to move, because it requires people to come back often. That is why the two metrics together say more than either one alone: one reveals the size of the base, the other reveals the habit.
The DAU/MAU ratio: the stickiness metric
The DAU/MAU ratio is the average DAU of a period divided by the MAU of the same period, expressed as a percentage. It is the most direct way to measure stickiness, how habit-forming the product is: how many of the users who appear in the month come back on a typical day. A ratio of 25% means the average user opens the product on about one in every four days, roughly seven or eight days a month.
Reading the ratio as a return frequency is what makes it powerful. It answers a question that raw user growth hides: are people forming the habit of coming back, or just passing through once? That is why DAU/MAU usually travels alongside the Engagement rate, which describes how deeply each user interacts within those visits.

What counts as a good DAU/MAU
There is no universal number, but there are widely used reference ranges. A common rule of thumb treats something around 20% as a respectable ratio and considers 50% or more as exceptional, typical of products that have become a daily habit, such as messengers and collaboration tools. Successful social and communication apps tend to live in the high band.
- Below 10%: sporadic use, the product has not entered the routine yet.
- 10% to 20%: moderate engagement, with clear room to improve.
- 20% to 50%: a sticky product, a meaningful share of the base returns several times a week.
- Above 50%: a consolidated daily habit, rare and valuable.
Before comparing, look at your product category. Industry benchmark studies, such as the annual Benchmarkit report, show that engagement and retention vary widely by type of software, so the best reference is always that of products similar to yours.
Defining "active" honestly
DAU/MAU is only as good as the definition of "active" behind it. If "active" is merely opening the app or logging in, the number inflates and starts measuring curiosity, not value. If it is an action that represents the product moment of value, such as sending a message, creating a report or completing a task, the metric starts reflecting real use. The choice of definition changes the result more than any product optimization.
Two disciplines make the number trustworthy. The first is to anchor "active" in the value action, not in a simple access. The second is to keep that definition stable over time, because redefining "active" midway breaks any historical comparison. It is also worth separating the base: your Power users pull the average up and deserve to be analyzed apart, so the aggregate ratio does not hide a long tail of barely active users.
When DAU/MAU is (and is not) the right lens
The DAU/MAU ratio makes sense when the product has a natural daily cadence. Communication, collaboration, entertainment and productivity tools benefit from the lens, because the expected value is precisely the frequent return. In those cases, a low DAU/MAU is a legitimate warning sign.
Products with a naturally monthly or quarterly cadence, on the other hand, are done a disservice by this metric. A payroll software that runs once a month, or an accounting close tool, will have a structurally low DAU/MAU without that meaning any problem at all. For them, it makes more sense to measure WAU/MAU, the fraction that returns within the week, or to pair usage with the outcome the product promises to deliver. That is why DAU/MAU should rarely be the North Star Metric on its own: it is a habit indicator, not the final measure of value delivered.
DAU/MAU alongside other product metrics
DAU/MAU does not live in isolation; it anticipates what other metrics confirm later. Falling stickiness is often a leading indicator of Churn: when users stop coming back day to day, the formal cancellation tends to follow. That is why the ratio works as an early signal of health, weeks or months before churn shows up in revenue.
The richest reading comes from crossing the three layers. MAU shows the size of the reach, the DAU/MAU ratio shows the frequency of the habit, and engagement shows the depth of each visit. A product can have high MAU and low stickiness (many people come in, few return) or the opposite (a small but hooked base). Only by looking at the layers together can you tell whether growth is solid or just passing volume.
Frequently asked questions
DAU are the daily active users (Daily Active Users) and MAU are the monthly active users (Monthly Active Users). Both count unique users who took a relevant action in the product, over a day and a month respectively.
The difference is the time window. DAU counts the unique users active in a day; MAU counts the unique users active over thirty days. MAU tends to be larger, because the user only has to appear once in the month.
They are counts of active users in different windows: DAU over the day, WAU (Weekly Active Users) over the week and MAU over the month. Comparing these windows helps you understand how often people come back to the product.
Divide the average DAU of a period by the MAU of the same period and multiply by 100. For example, an average DAU of 5,000 over a MAU of 25,000 gives a ratio of 20%.
It depends on the category, but a common rule of thumb treats around 20% as respectable and 50% or more as exceptional, typical of daily-use products. Products with a monthly cadence naturally have lower ratios.
Stickiness is how habit-forming a product is, measured by the DAU/MAU ratio. It shows what fraction of monthly users comes back on a typical day, that is, whether the product has become a habit or is used only occasionally.
Related concepts

Engagement rate
Engagement rate measures how intensely the base uses the product: the share of users who perform the key value action in a period. There is no single formula, each product defines that action. High engagement precedes retention and expansion; low engagement precedes churn.

Power users
Power users are the small fraction of a product most engaged and frequent users, who get the most out of it and tend to generate a disproportionate share of activity and value, a Pareto effect. They are the main source of expansion, referrals and feedback, and understanding what makes them power users guides the roadmap and the onboarding of everyone else.

North Star Metric
The North Star Metric is the single guiding metric that best captures the value a product delivers to its customers and predicts sustainable growth. It sits above the input metrics that feed it and aligns every team around real value, not vanity numbers. Chosen well, it rises when the customer wins, not when the company extracts.