
Engagement rate: what it is and how to measure it in SaaS
By Tiago Costa · Updated on July 9, 2026

Definition
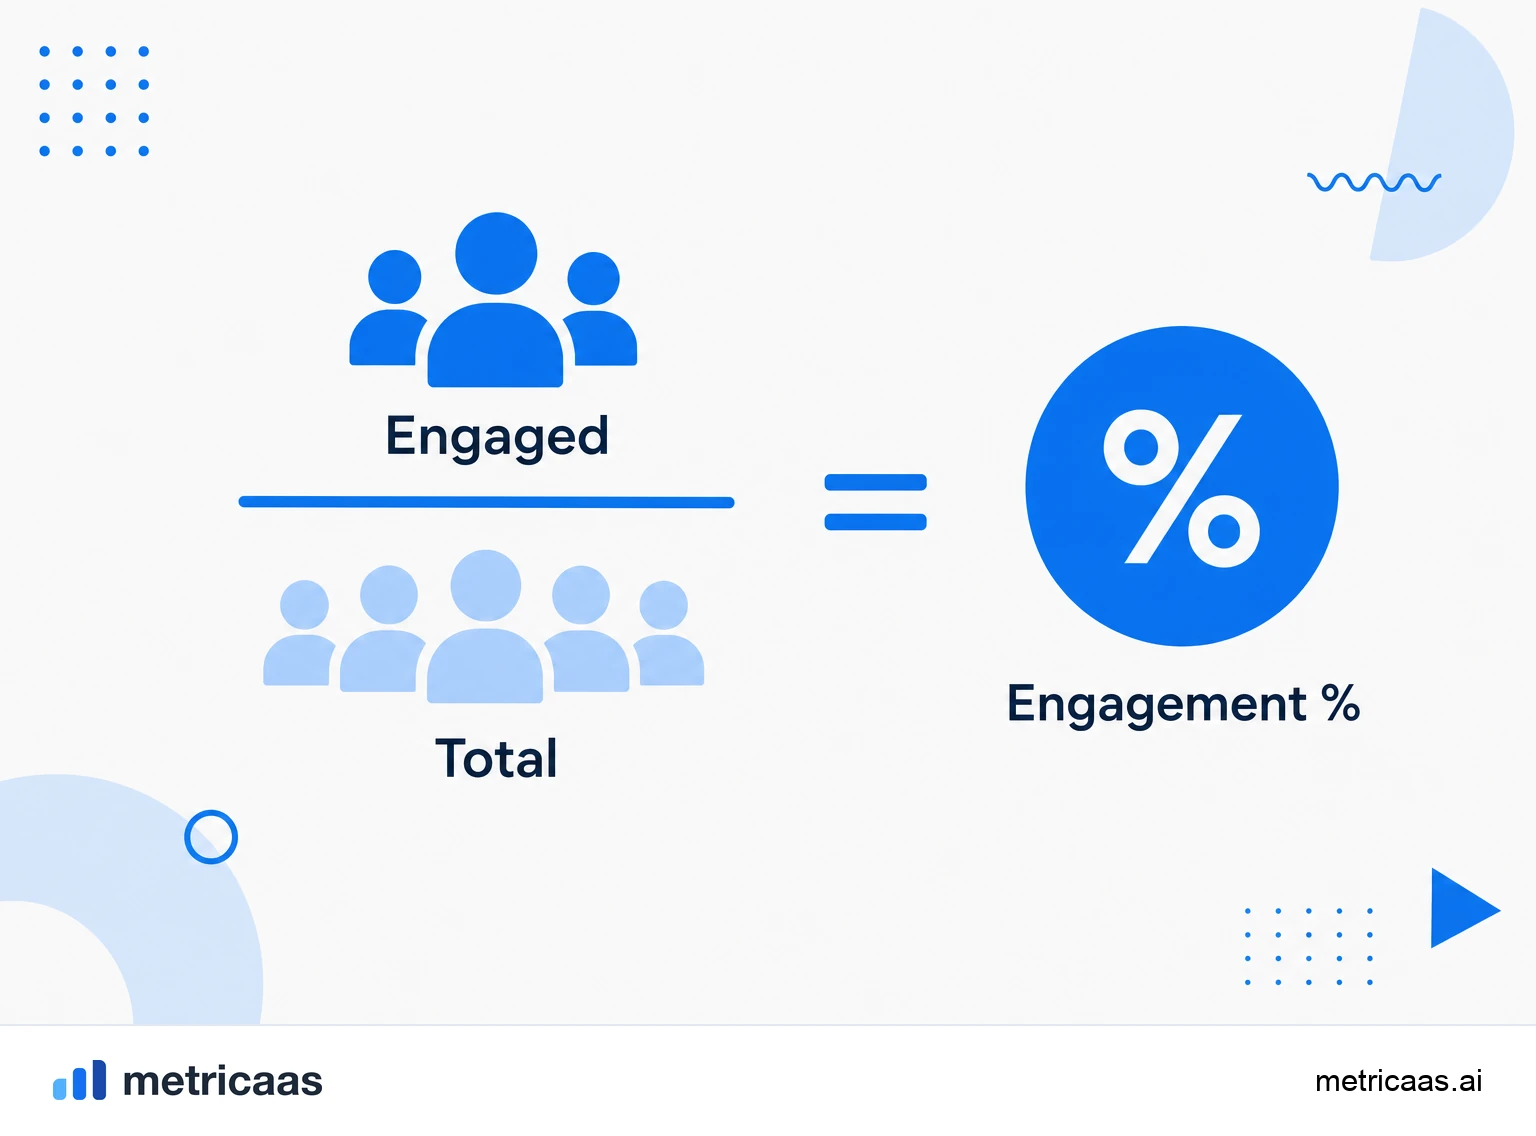
The engagement rate measures how intensely the base uses the product: users who perform the key value action over the total, in a period.
- There is no single formula: each product defines the action that represents value.
- DAU / MAU is one way to measure it.
- High engagement precedes retention and expansion; low precedes churn.
What engagement rate is
The engagement rate measures how intensely the base uses the product: how many users actually perform the action that represents value, over the total number of users, within a period. It is not a vanity metric about logins, but a picture of who truly gets value from what you ship.
The part that trips people up is that there is no single formula. Each product defines the key action that counts as engagement: sending a message, publishing a report, closing a deal inside the system, inviting a teammate. What matters is choosing the behavior that correlates with customers staying and growing, then measuring the share of the base that repeats it.
How to calculate engagement rate
The general shape is simple: active users who perform the key action, divided by the total number of users, over the chosen period. What changes from one SaaS to another is the definition of active and of key action, and that is where the real work lives.
- Engagement rate = (users who do the key action ÷ total users) over the period.
- Define the value action before you calculate; without it, the number means nothing.
- Pick a window (day, week, month) that matches the product natural usage frequency.
A common approach is to anchor the key action to the North Star Metric, the metric that captures the value delivered to the customer. That way engagement rate stops being a loose number and starts measuring how many users reach the moment the product keeps its promise.
DAU/MAU: the stickiness ratio
One of the best-known ways to measure engagement is the DAU / MAU ratio, daily active users divided by monthly active users. It answers a direct question: on how many days of the month does the typical user come back to the product.
A DAU/MAU of 50% suggests the average user opens the product about fifteen days a month, a sign of a strong habit; below 10% or 20%, usage tends to be occasional. Keep in mind the bar depends on the product type: a daily-use tool and software touched once a quarter cannot be judged against the same line.
Depth and breadth of engagement
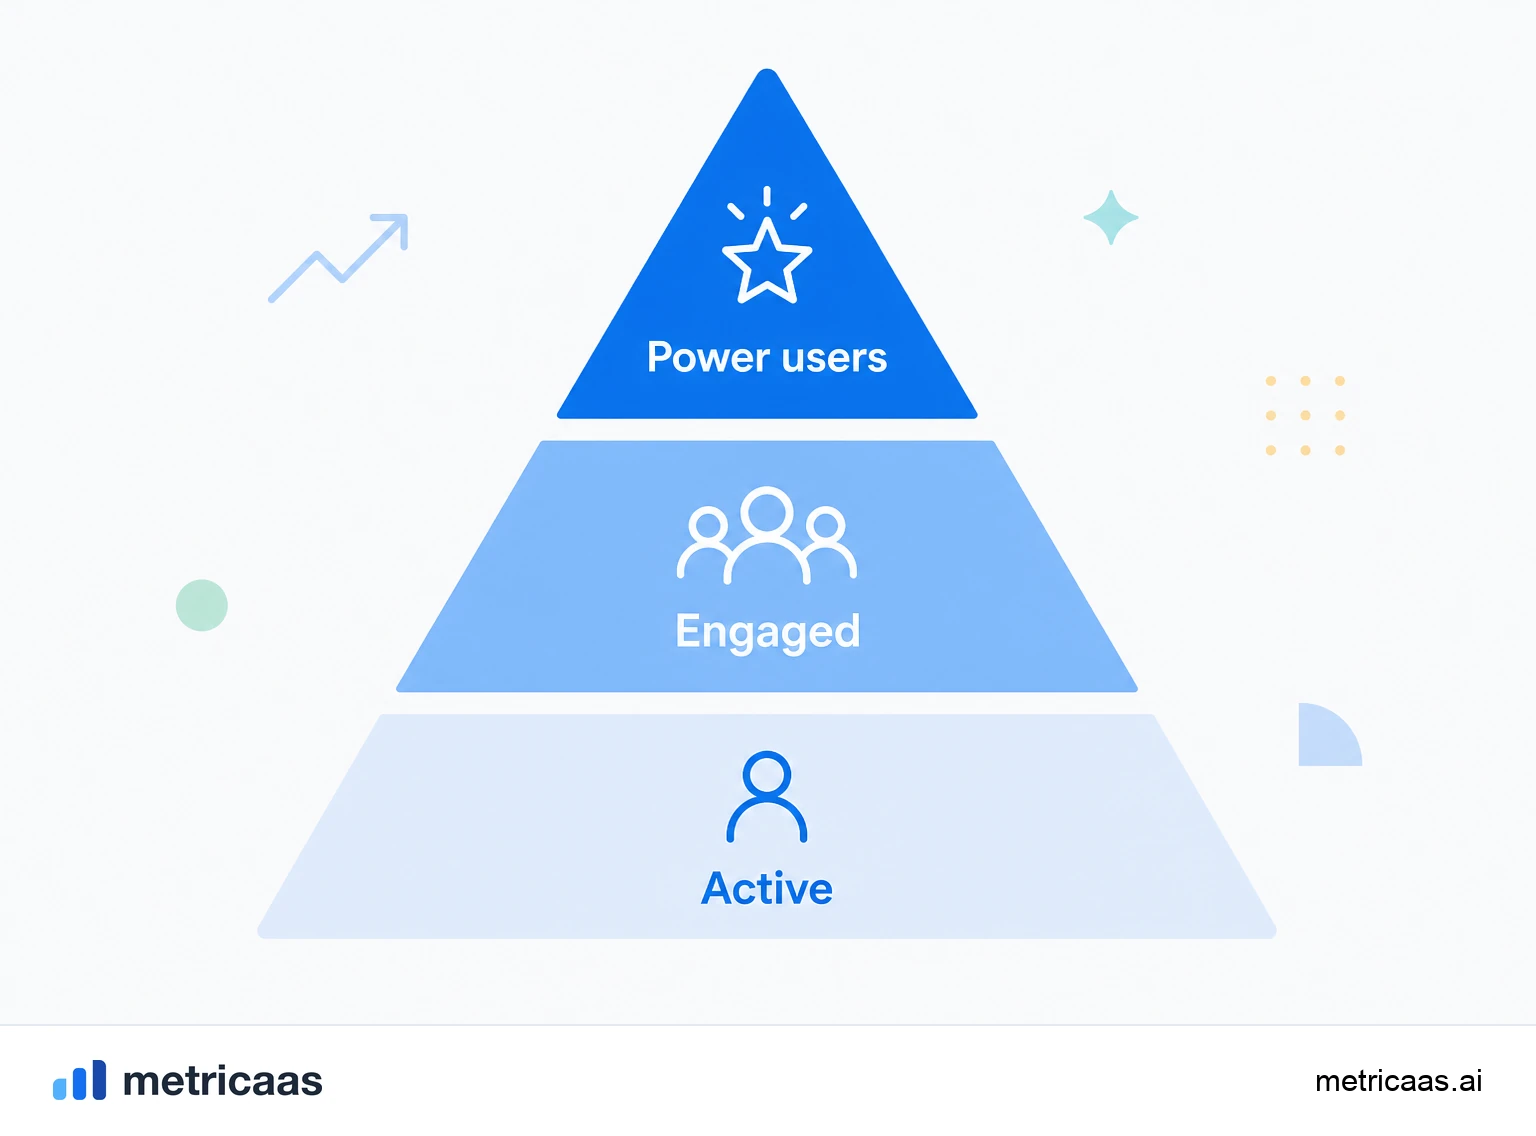
Engagement has two dimensions worth separating. Breadth asks how many users in the base are active; depth asks how intensely each one uses it, how many key actions per session, how many features adopted, how much value over time.
A broad but shallow base (lots of people who show up and do little) is fragile. A smaller but deeper base is usually healthier, because it concentrates power users who extract a lot of value and pull expansion. Measuring breadth alone hides this contrast; looking at both dimensions together shows where the product really lands.
Engagement precedes retention, churn and expansion
The reason engagement rate matters so much is that it is a leading indicator. Users who engage often and deeply tend to renew and buy more; users who fade from the product tend to cancel weeks or months later. Engagement moves before revenue, which is why it works as an early warning.
In practice, a drop in engagement inside an account is one of the most reliable signs of churn to come, with enough lead time for the team to act before the cancellation. On the other side, highly engaged accounts are the natural ground for upsell and cross-sell. Benchmark reports such as those from Benchmarkit show how retention and expansion sustain SaaS growth, and both begin with engagement.
How to use engagement rate without fooling yourself
Do not ask this metric for a universal good-or-bad number. Unlike financial metrics, engagement only makes sense against your own baseline and product type. The value is in the trend (rising or falling) and in comparing segments, plans and cohorts, not in copying a percentage from outside.
- Define the key action and keep the definition stable so you can compare over time.
- Segment: engagement by plan, by entry cohort and by customer profile reveals more than the overall average.
- Combine breadth and depth, and cross-check against retention to confirm the chosen action really predicts staying.
Done this way, engagement rate becomes the product health dashboard: it shows early where value is being delivered, where it is leaking, and where to invest to turn usage into recurring revenue.
Frequently asked questions
Divide the users who perform the key action by the total number of users in the period. The formula is simple; the hard part is defining well which action represents value in your product.
There is no universal number. What counts as good depends on the product type and your own baseline. Tracking the trend and comparing cohorts matters more than chasing an outside percentage.
Engagement measures how intensely people use the product now; retention measures who keeps coming back over time. Engagement is a leading indicator of retention.
It is the ratio of daily active to monthly active users, a classic way to gauge stickiness: on how many days of the month the typical user returns to the product.
It usually precedes it. A drop in usage is one of the most reliable signs of an upcoming cancellation, and it gives you time to act before the account is lost.
No. Each product defines the key action that represents value. The pattern is active users on that action over the total, but the action itself varies from business to business.
Related concepts

DAU / MAU
DAU and MAU are the daily active users (Daily Active Users) and monthly active users (Monthly Active Users) of a product. The DAU/MAU ratio, obtained by dividing average DAU by MAU, is the stickiness metric: it shows what fraction of monthly users comes back on a typical day. Near 50% indicates a product of daily use; a low ratio indicates occasional use. The number only means something if "active" is defined honestly.

North Star Metric
The North Star Metric is the single guiding metric that best captures the value a product delivers to its customers and predicts sustainable growth. It sits above the input metrics that feed it and aligns every team around real value, not vanity numbers. Chosen well, it rises when the customer wins, not when the company extracts.

Power users
Power users are the small fraction of a product most engaged and frequent users, who get the most out of it and tend to generate a disproportionate share of activity and value, a Pareto effect. They are the main source of expansion, referrals and feedback, and understanding what makes them power users guides the roadmap and the onboarding of everyone else.