
Power users: who they are, how to spot them and why they matter
By Tiago Costa · Updated on July 9, 2026

Definition
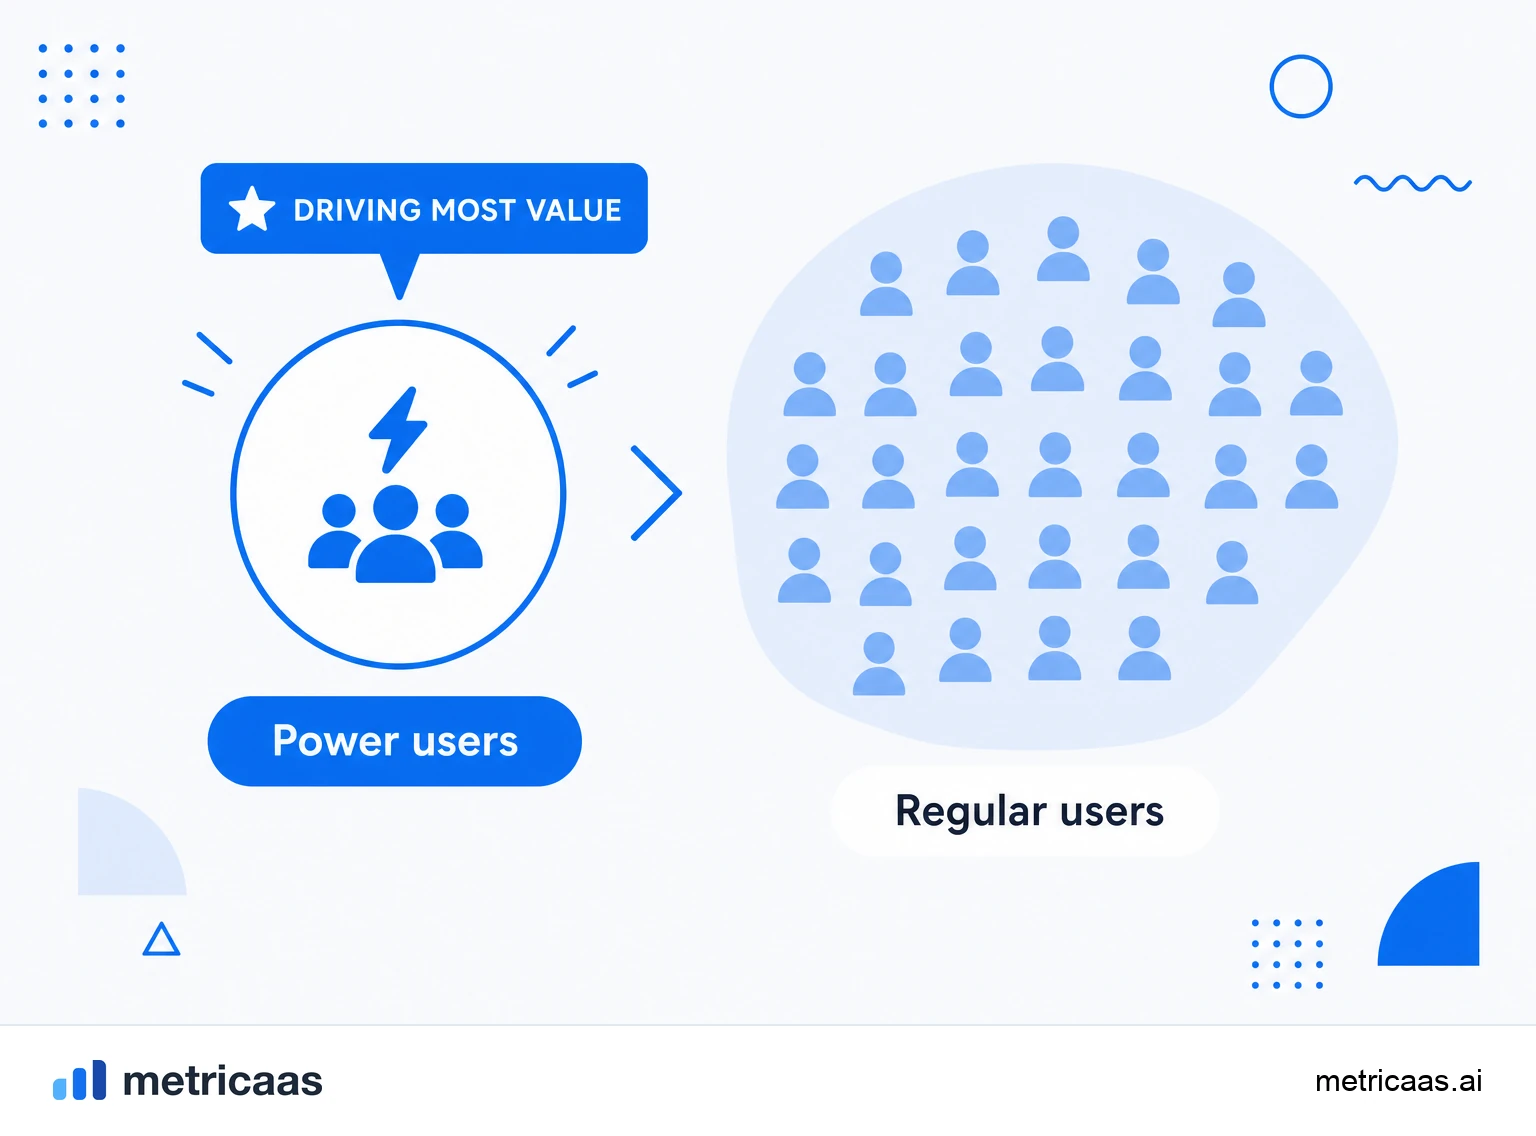
Power users are the small fraction of a SaaS most engaged users, who use the product more deeply and frequently and generate a disproportionate share of value.
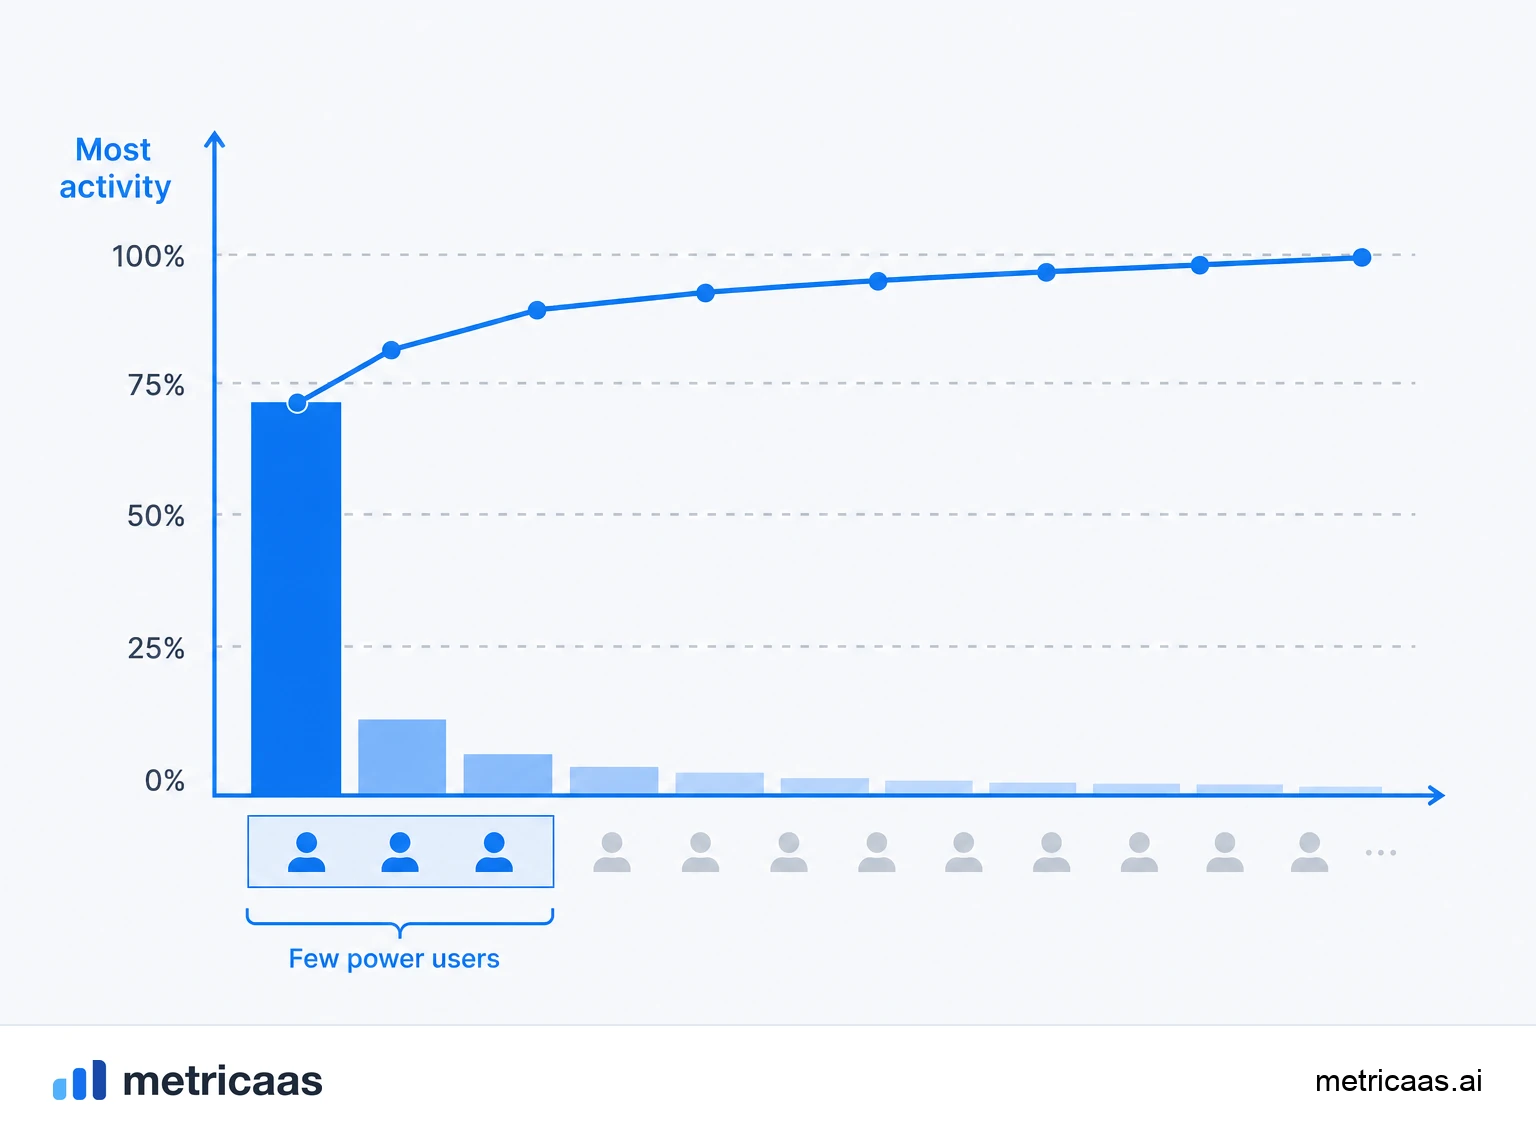
- Pareto effect: a few users account for most of the activity.
- Source of revenue expansion, referrals and qualified feedback.
- Mapping what makes them power users guides the roadmap and onboarding.
What power users are
Power users are the users who get the most out of a product: they log in often, use advanced features, adopt more flows than average and weave the tool into their daily work. They are not necessarily the ones who pay the most, but they are almost always the ones who depend on the product the most, which makes them the hardest to lose.
The defining trait is the intensity of the relationship with the product, not the job title or the plan. A power user usually has both depth (uses features most people ignore), breadth (touches several parts of the product) and frequency (comes back many times a week). That combination is what separates someone who merely keeps the account active from someone who actually lives inside the tool.
How to identify your power users
Identifying power users is a data exercise, not a matter of intuition. The basis is observing behavior over time and crossing three dimensions: how often a person returns, how deep they go in the product and how many meaningful actions they take.
- Frequency: sessions per week, active days per month, consistent return rather than isolated spikes.
- Depth: use of advanced features, settings, automations and integrations that most people never touch.
- Breadth: number of different modules or flows the person activates.
- Value actions: events that represent the product "aha" moment, repeated regularly.
A quick clue is the DAU / MAU ratio: users with stickiness well above the product average are natural power-user candidates. From there, looking at the engagement rate per account helps separate people who truly use the product from those who just keep a login active.
Setting the power-user threshold
There is no universal threshold: what makes someone a power user depends on your product and the value it delivers. The common mistake is copying a generic ruler ("used it 3 times this week") without checking whether it really separates who stays from who disappears.
A solid path is to define the threshold by its correlation with retention and revenue. Look at the usage distribution, find the point where the retention curve takes off, and anchor there. Rather than picking a round number, let the data point to the cut-off.
- Choose one or two core actions that represent real value, not vanity.
- Fix a time window (for example, per week or per month) to measure intensity.
- Validate the cut-off by checking whether, above it, retention and expansion actually rise.
- Revisit the threshold as the product evolves and new features change what "using it well" means.
Why power users matter
Power users matter because they generate disproportionate value. The Pareto effect applies here: a small fraction of the base tends to account for most of the activity, expansion revenue and referrals. Losing a power user hurts far more than losing a casual user, both for the revenue and for the network effect they sustain.
- Expansion: they adopt paid features the most, upgrade plans and add seats, lifting Net Revenue Retention (NRR).
- Referral: they become natural promoters, bringing in colleagues and new accounts at low acquisition cost.
- Retention: because they depend on the product, they have the lowest churn and anchor recurring revenue.
- Feedback: they give the most qualified input, because they know the product limits in practice.
How power users guide roadmap and onboarding
Beyond sustaining revenue, power users are a map. Studying what they do reveals which features deliver real value and which sequence of actions leads someone to stick. That pattern becomes the backbone of the roadmap and the onboarding.
The idea is to reverse-engineer success: find the habits that separate a power user from a lukewarm one and design onboarding to get newcomers to those habits as fast as possible. If power users always set up an integration in the first week, that integration should become a guided step for everyone. Prioritize on the roadmap what deepens usage for those who already love the product, without losing sight of what unblocks the rest.
Metrics to track power users
Tracking power users requires looking at engagement and revenue together, because one without the other misleads. A good dashboard combines usage intensity with the financial impact of that intensity.
- Stickiness (DAU / MAU): shows how many users come back almost every day, the heart of power behavior.
- Engagement rate: the share of the base performing value actions in the period.
- Net Revenue Retention (NRR): captures the expansion power users pull.
- Segment churn: tracked separately, it should be much lower in the power group.
SaaS benchmarks, such as those compiled by Benchmarkit in its annual survey, show that expansion from the existing base is one of the biggest growth engines, and it is power users who sustain it. Reading these metrics by segment, not just in aggregate, is what turns the concept into a decision.
Frequently asked questions
It is a product most engaged and frequent user, who uses advanced features, weaves the tool into their routine and generates a disproportionate share of the activity and value.
By crossing data on frequency (active days), depth (advanced features) and breadth of use, and looking at who performs the product value actions regularly. The DAU / MAU ratio is a good starting point.
A regular user keeps the account active and uses the basics; a power user goes deep, adopts advanced features, returns more often and depends on the product, which makes them harder to lose.
Super user and administrator are permission roles, defined by the access a person has. Power user is a behavior, defined by usage intensity. An admin may not be a power user, and vice versa.
Choose one or two core value actions, fix a time window and anchor the cut-off where retention and expansion take off. Let the data define the number instead of copying a generic ruler.
Because they generate disproportionate value: they pull revenue expansion, bring referrals, have the lowest churn and give the most qualified feedback. Studying them guides the roadmap and onboarding of everyone else.
Related concepts

DAU / MAU
DAU and MAU are the daily active users (Daily Active Users) and monthly active users (Monthly Active Users) of a product. The DAU/MAU ratio, obtained by dividing average DAU by MAU, is the stickiness metric: it shows what fraction of monthly users comes back on a typical day. Near 50% indicates a product of daily use; a low ratio indicates occasional use. The number only means something if "active" is defined honestly.

Engagement rate
Engagement rate measures how intensely the base uses the product: the share of users who perform the key value action in a period. There is no single formula, each product defines that action. High engagement precedes retention and expansion; low engagement precedes churn.

Net Revenue Retention (NRR)
Net Revenue Retention (NRR) measures how much of the recurring revenue from your current base you keep over time, already accounting for upgrades and expansion, minus downgrades and cancellations. Above 100% it means the base grows on its own, even without new customers.