
Viral coefficient (K-factor): what it is and how to calculate it
By Tiago Costa · Updated on July 9, 2026

Definition
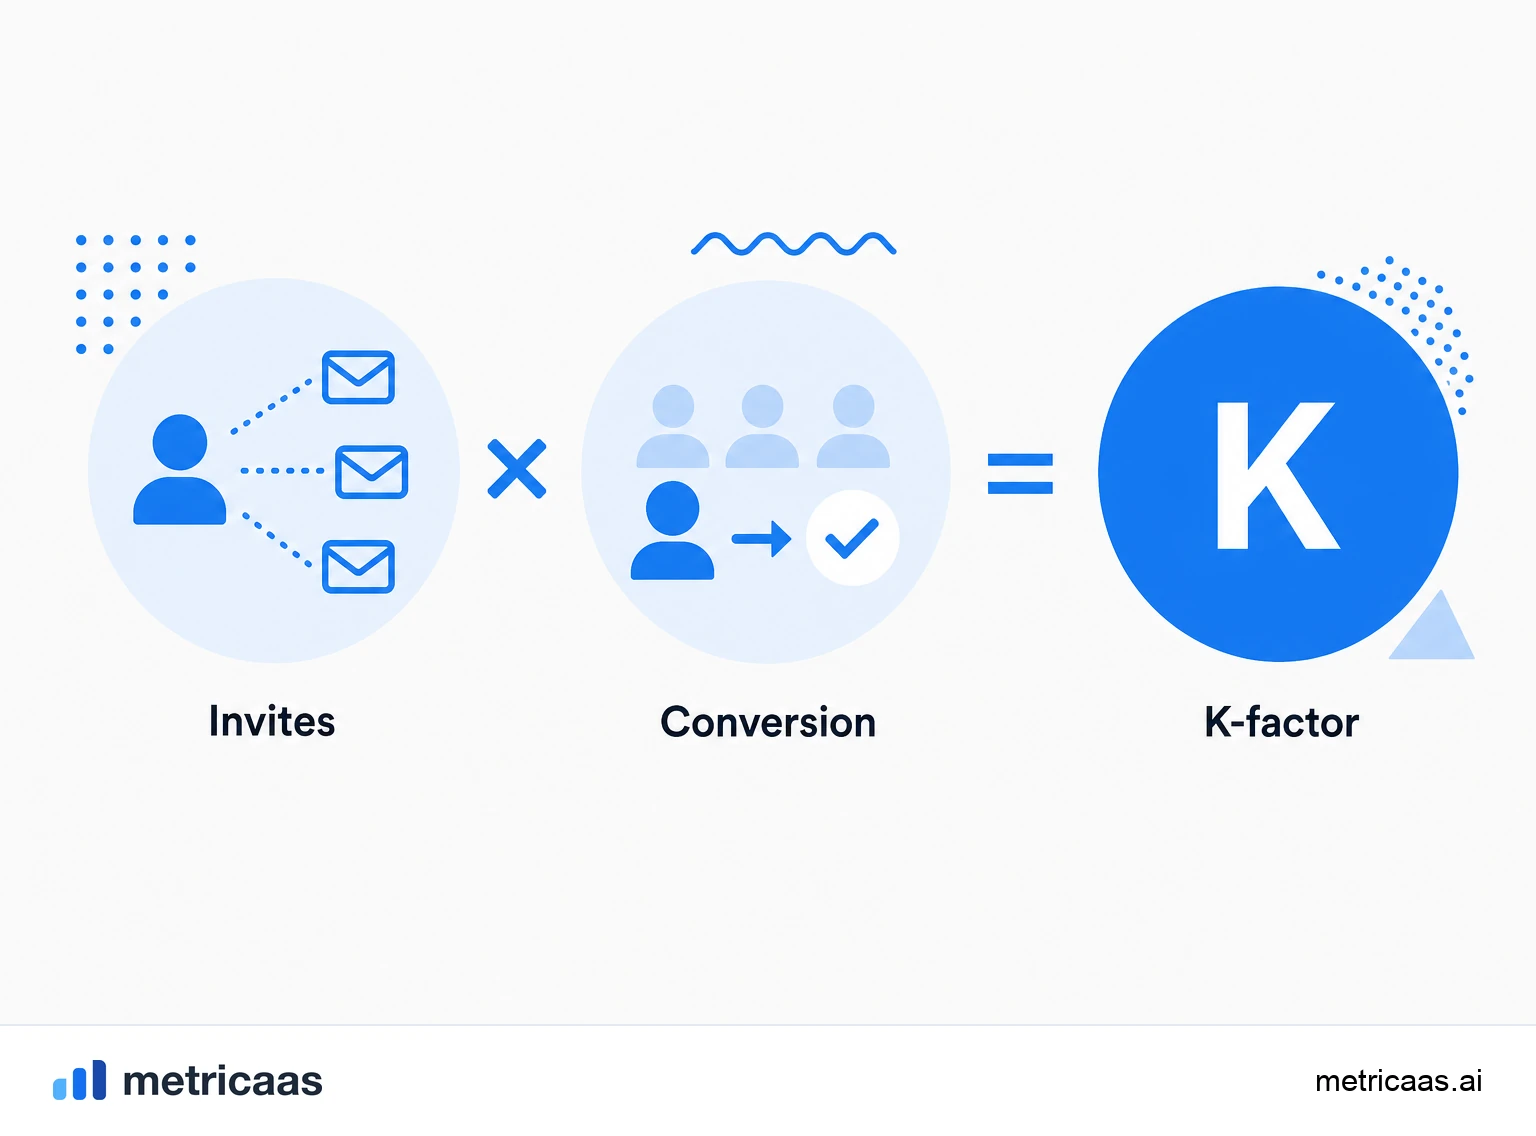
The viral coefficient (K-factor) measures how many new users each current user brings: K = invites per user x invite conversion rate.
- K above 1 means self-sustaining viral growth.
- K below 1 amplifies other channels but does not replace them.
- The viral cycle time sets the speed of that effect.
What the viral coefficient is
The viral coefficient, also called the K-factor, measures how many new users each current user brings, on average, by inviting other people into the product. It captures, in a single number, the strength of the word of mouth built into usage itself: the higher the K, the more each person who joins multiplies the base without the company paying for it.
The idea comes from epidemiology, where the same concept describes how many people a virus carrier infects. In a SaaS, the "contagion" is the invite: a user shares a link, refers a colleague, or exposes the product inside a workflow, and some of those people become users too. The viral coefficient turns that diffuse behavior into a metric you can track and try to improve.
The K-factor formula
The K-factor comes from multiplying two simple factors:
- Invites per user (i): how many invites, on average, each user sends in a period.
- Invite conversion rate (c): the share of those invites that turns into a new active user.
The formula is K = i x c. If each user sends 5 invites and 20% of them convert, K is 5 x 0.20 = 1.0, meaning each current user generates, on average, one new user. To raise K you have only two levers: get people to invite more, or make invites convert better. The two multiply each other, so small gains in each combine into a large effect.
K above and below 1
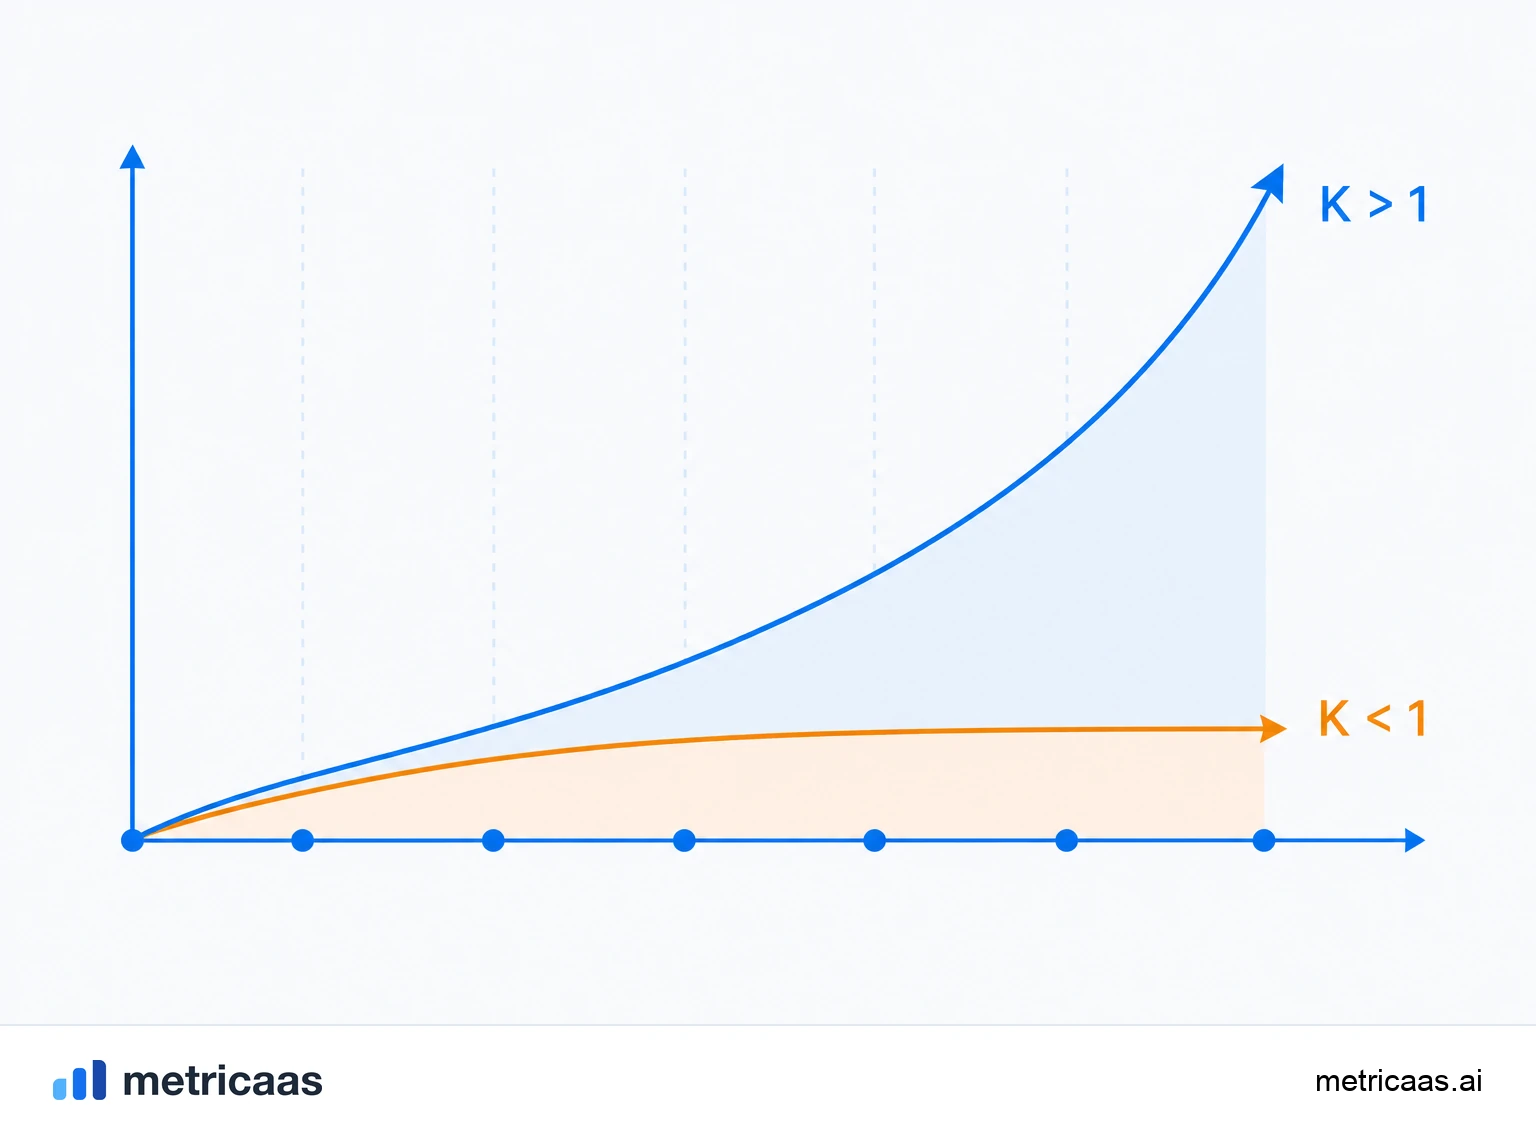
The tipping point is K = 1. Above it, each generation of users produces an even larger one, and the base grows exponentially and self-sustains: 100 users become 120, which become 144, and so on, with no extra acquisition spend. Below 1, each generation is smaller than the last and the viral effect decays until it stops.
That does not make a K below 1 useless, far from it. With K = 0.5, every user you acquire brings roughly one more user for free across the whole cascade, because 1 + 0.5 + 0.25 + ... approaches 2. Virality below 1 is an amplifier: it multiplies the output of your other channels instead of replacing them. The common mistake is treating K under 1 as a failure, when in practice it makes all the rest of acquisition cheaper.
Viral cycle time
K alone does not tell the whole story. What is missing is the viral cycle time, which is how long it takes between a user joining and their invites bringing in new users. Two products with the same K grow in radically different ways if one closes the loop in days and the other in months.
Because the effect compounds, shortening the cycle is often worth more than raising K by a few points. An invite that lands on the first day of use, inside a natural product flow, spins many times in the span where an invite requested only weeks later spins once. That is why truly viral products do not just invite more: they invite early and with low friction, so each turn of the loop happens as soon as possible.
Viral coefficient and paid acquisition
In practice, sustaining K above 1 for long is rare. Contact lists run dry, the network saturates, and novelty fades, so the K of almost every product ends up below 1. That is where virality shows its real value: as a reducer of acquisition cost, not as a replacement for paid channels.
The math is direct. If a paid channel brings users with K = 0.5, each purchased user yields about two users in total, which halves the effective CAC, the acquisition cost David Skok placed at the center of SaaS unit economics. The same logic applies to top-of-funnel metrics like cost per lead (CPL): each paid lead that becomes a user pulls more organic leads behind it. Treating the viral coefficient as part of the acquisition plan, rather than a side project, is what makes paid spend more efficient. Sources such as ForEntrepreneurs show how this effect changes the growth math of a SaaS.
Viral coefficient and referral programs
Referral programs are the most direct attempt to engineer a higher K. By giving an incentive to invite (credit, discount, unlocked feature) and by making sharing easy, the company moves both levers at once: more invites per user and, with a good two-sided offer, better conversion of each invite.
Even so, few programs push K above 1 in a lasting way, and the industry track record shows sustained virality is the exception, not the rule. The honest read is to look at the viral coefficient alongside the overall growth rate: a good program usually earns its keep not by making the product self-exponential, but by lowering acquisition cost and speeding up cycle time. Bessemer and other reference firms treat virality as a multiplier of existing channels, a lever that compounds with the others, rather than the single engine of growth.
Frequently asked questions
It is the metric that measures how many new users each current user brings, on average, by inviting other people. K above 1 signals self-sustaining viral growth; below 1, virality amplifies other channels without replacing them.
K = invites sent per user x invite conversion rate. If each user sends 5 invites and 20% convert, K = 5 x 0.20 = 1.0.
K = 1 is the tipping point: each current user generates, on average, exactly one new user. Above 1, the base grows exponentially; below, the viral effect decays until it stops.
Any K above 1 is rare and excellent, since it drives self-sustaining growth. In practice most products land below 1, and even a K of 0.4 to 0.7 is valuable because it makes paid acquisition cheaper.
You have two levers: increase invites per user and improve the conversion of each invite. Shortening the viral cycle time, by inviting early and with low friction, is often worth as much as raising K.
Only when K stays above 1 in a sustained way, which is rare. In most cases virality complements paid channels, cutting the effective CAC instead of replacing acquisition spend.
Related concepts

CAC
CAC (Customer Acquisition Cost) is how much, on average, you spend to win a new customer. Add up everything invested in marketing and sales over a period and divide by the number of new customers who came in during that period. It is the metric that tells you whether your growth is economically healthy.

Growth rate
Growth rate measures how fast a SaaS revenue (or customer base) moves between two periods, expressed as a percentage. It can be monthly (MoM), yearly (YoY) or quarterly, and the formula is always the change divided by the starting value. The YoY view smooths seasonality, while compound MoM reveals whether the business is accelerating or slowing down.

Cost per lead (CPL)
Cost per lead (CPL) is the marketing spend of a period divided by the number of leads generated in that period. It measures how much it costs, on average, to attract an interested contact, and it sits before CAC in the acquisition funnel. It is mainly used to compare channels, as long as you also look at the quality and conversion of the leads, not just the price.