
Lead scoring: what it is, how to do it and how to calibrate lead points
By Tiago Costa · Updated on July 9, 2026

Definition
Lead scoring assigns points to each lead by fit with the ICP and by engagement, to prioritize who sales contacts first.
- Two dimensions: fit (who the lead is) and engagement (what they do).
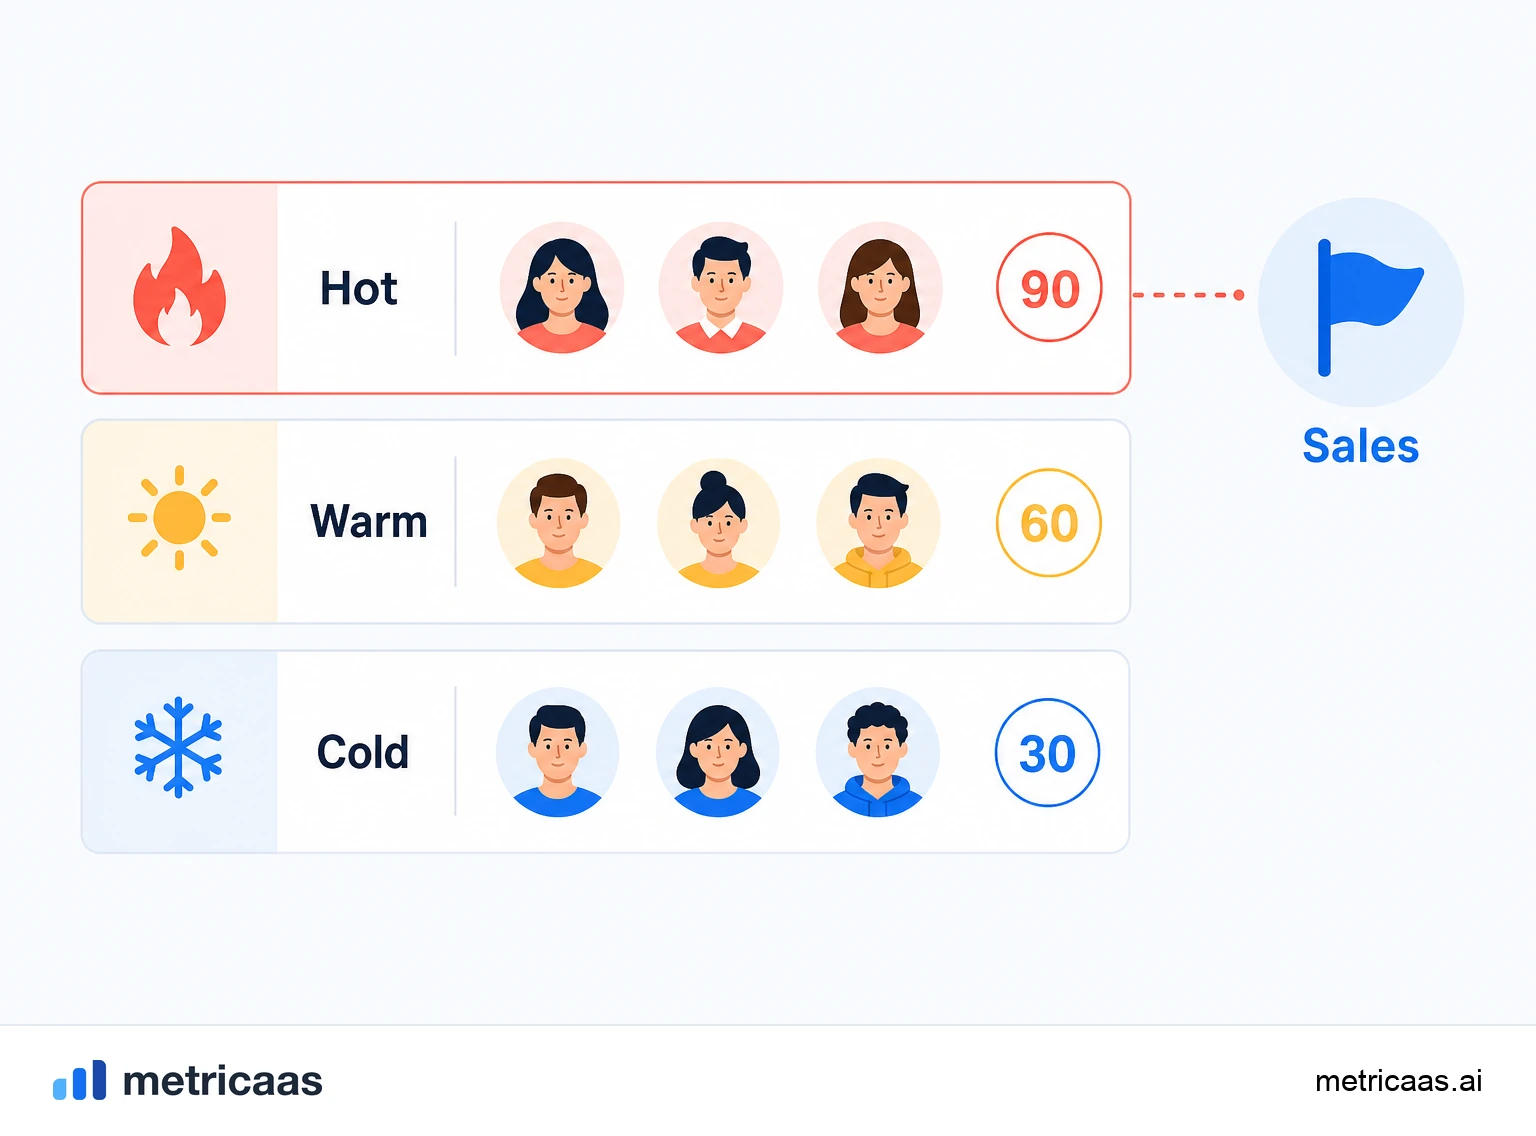
- Ranks the queue into hot, warm and cold leads.
- Improves MQL-to-SQL conversion and team focus.
What lead scoring is
Lead scoring is the practice of giving each lead a number that says, at a glance, how much of the sales team attention they deserve right now. Instead of working the queue in the order leads arrive, the company adds points as a lead gets closer to the ideal customer and as they show interest, and uses that total to decide who to contact first.
The idea solves a simple problem: not every lead is worth the same effort. A long contact list hides a few ready to buy and many that are not yet. Scoring makes that difference visible, splits hot leads from warm and cold ones, and keeps a rep from spending the morning on someone who only downloaded an ebook out of curiosity.
Fit and engagement: the two dimensions
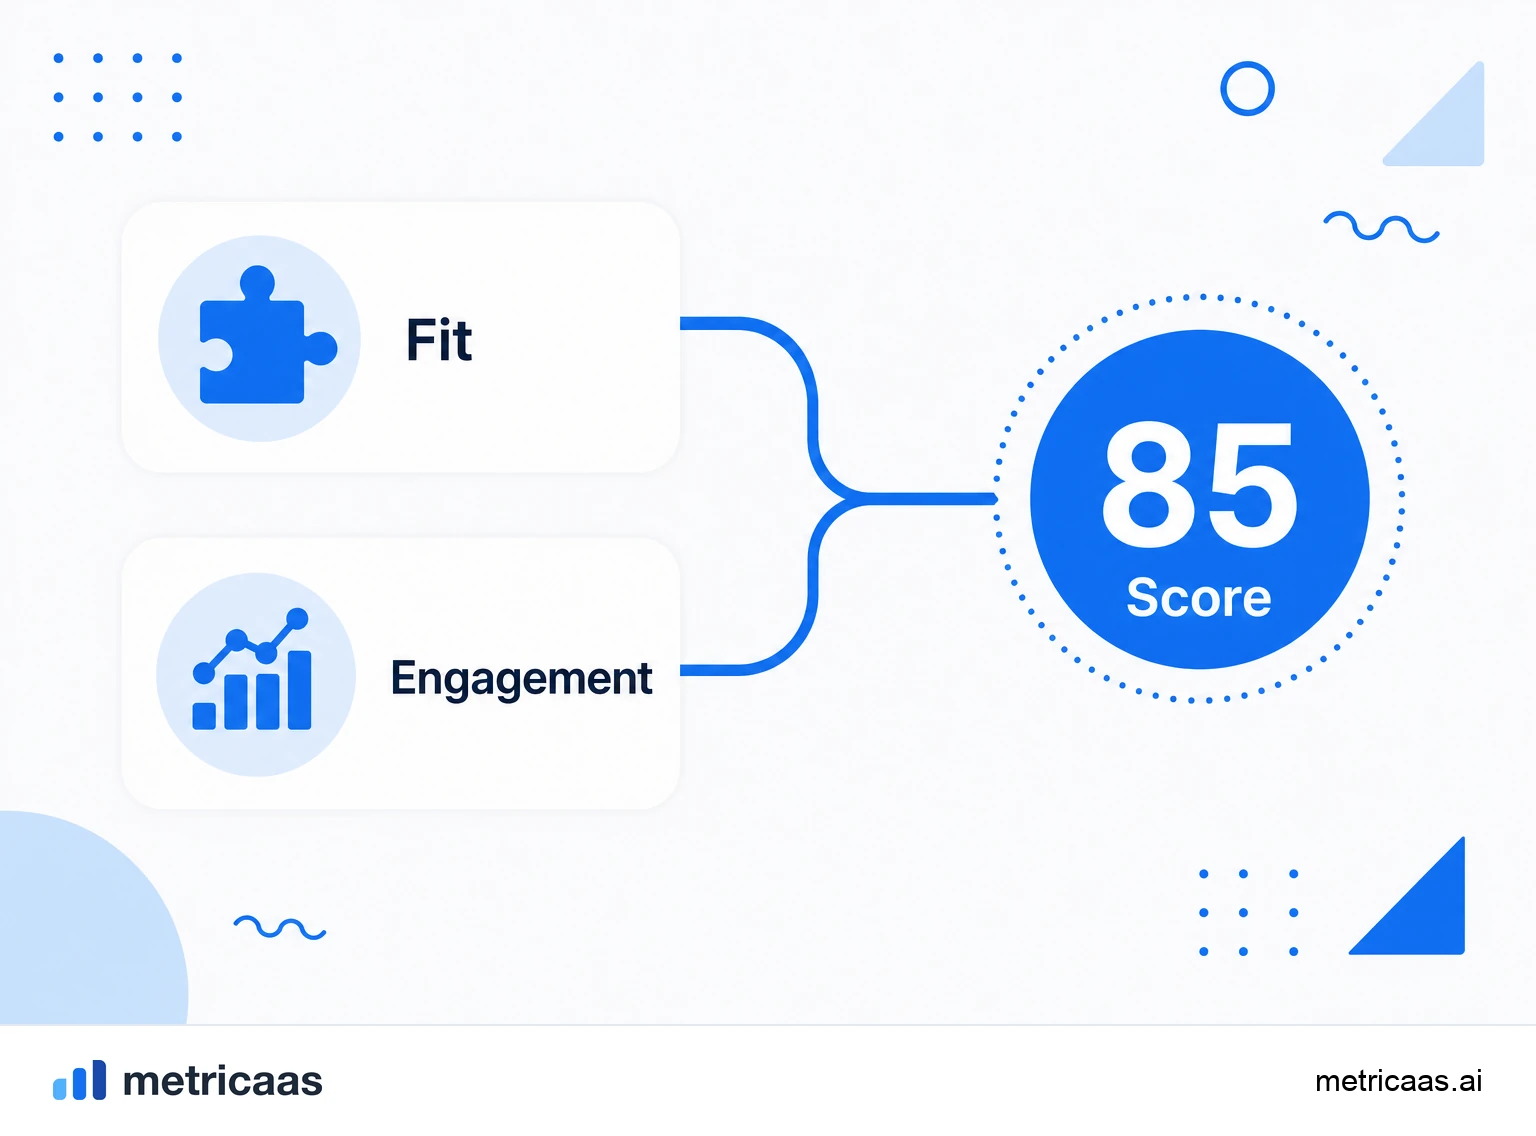
Every serious lead scoring model combines two independent dimensions. Fit answers "who is this lead" and measures how well they match the ICP: industry, company size, job title, region, budget. Engagement answers "what does this lead do" and measures their actions: opening emails, visiting the pricing page, requesting a demo, returning to the site several times in the same week.
- High fit and high engagement: hot lead, top sales priority.
- High fit and low engagement: matches the ICP but has cooled off, a nurturing target.
- Low fit and high engagement: enthusiastic but off-profile, be careful not to waste the team.
- Low fit and low engagement: cold lead, stays at the back of the queue.
Crossing the two dimensions, rather than adding everything into a single number, avoids the classic mistake of a click-happy but totally off-profile lead jumping the queue ahead of an account that fits the product perfectly.
How to build a lead scoring model
Building a model starts by defining the destination. List the fit attributes that describe your best customers and the engagement actions that usually precede a purchase, then assign weights to each signal according to its strength. Requesting a demo is worth far more than opening an email, so it should score far more.
- Pick the fit signals: job title, size, industry and other ICP data.
- Pick the engagement signals: pricing page visits, downloads, email opens, product usage.
- Assign weights: high-intent signals score more; weak signals score little.
- Set the thresholds: how many points turn a lead into an MQL or SQL and hand it to sales.
The first model is never perfect. It is a hypothesis about what predicts a purchase, and the score only gains value when it is reviewed against what actually happens in the funnel.
Explicit and behavioral scoring (and decay)
It is worth distinguishing two types of scoring. Explicit scoring uses data declared by the lead or enriched from external sources: job title, industry, company size. It is stable and relates to fit. Behavioral scoring uses what the lead does over time: pages visited, emails opened, product events. It is dynamic and relates to engagement.
Because behavior ages, a good model applies decay: points earned from a visit three months ago are worth less today than yesterday. Without decay, old leads accumulate points by inertia and keep looking hot long after they have cooled. Decay keeps the score faithful to current interest, not to a frozen history.
Lead scoring in PLG: the weight of the PQL
In self-serve products and free trials, the strongest signal is not the job title or the industry, it is usage. When someone activates a core feature, invites colleagues or hits the free plan limit, they show real intent in a way no form captures. That pattern gives rise to the Product Qualified Lead (PQL).
That is why, in PLG, the weight of product engagement tends to outweigh demographic fit. A user who has already felt the product value, even at a company outside the classic ICP, often closes faster than a perfect-profile lead who never got past sign-up. Lead scoring in a PLG has to read usage events, not just marketing clicks.
Calibrate against who actually closes
A lead scoring model is only worth what the data confirms. Calibration means looking back at the leads that became customers and asking whether the high score really preceded the close. If score-90 leads close at the same rate as score-40 ones, the model is separating nothing and needs new weights.
The indicators that reveal this are MQL-to-SQL conversion and the win rate by score band: in a healthy model, the higher the score, the higher the advance and close rate. Funnel conversion benchmarks, such as those compiled by Benchmarkit, help compare your numbers with the market. The rule is to treat the model as alive: review the weights every quarter as the profile of who closes shifts.
Frequently asked questions
Lead scoring means assigning a score to each lead based on fit with the ICP and engagement, to prioritize who sales should contact first. The higher the score, the hotter the lead.
Define the fit and engagement signals, weight them by strength, add up the points and set thresholds for MQL and SQL. Then calibrate the weights against who actually closes.
Hot leads (high fit and high engagement, ready for sales), warm leads (partial interest or fit, still nurturing) and cold leads (low score, at the back of the queue).
Explicit scoring uses declared data such as job title and industry and measures fit. Behavioral scoring uses actions such as visits and product usage and measures engagement, usually with decay over time.
In PLG, product usage outweighs demographic fit. Signals such as activating a core feature or hitting the free plan limit create a PQL, often more predictive than any form data.
By comparing MQL-to-SQL conversion and win rate by score band. If high scores convert better than low ones, the model separates well; if not, it is time to readjust the weights.
Related concepts
MQL / SQL
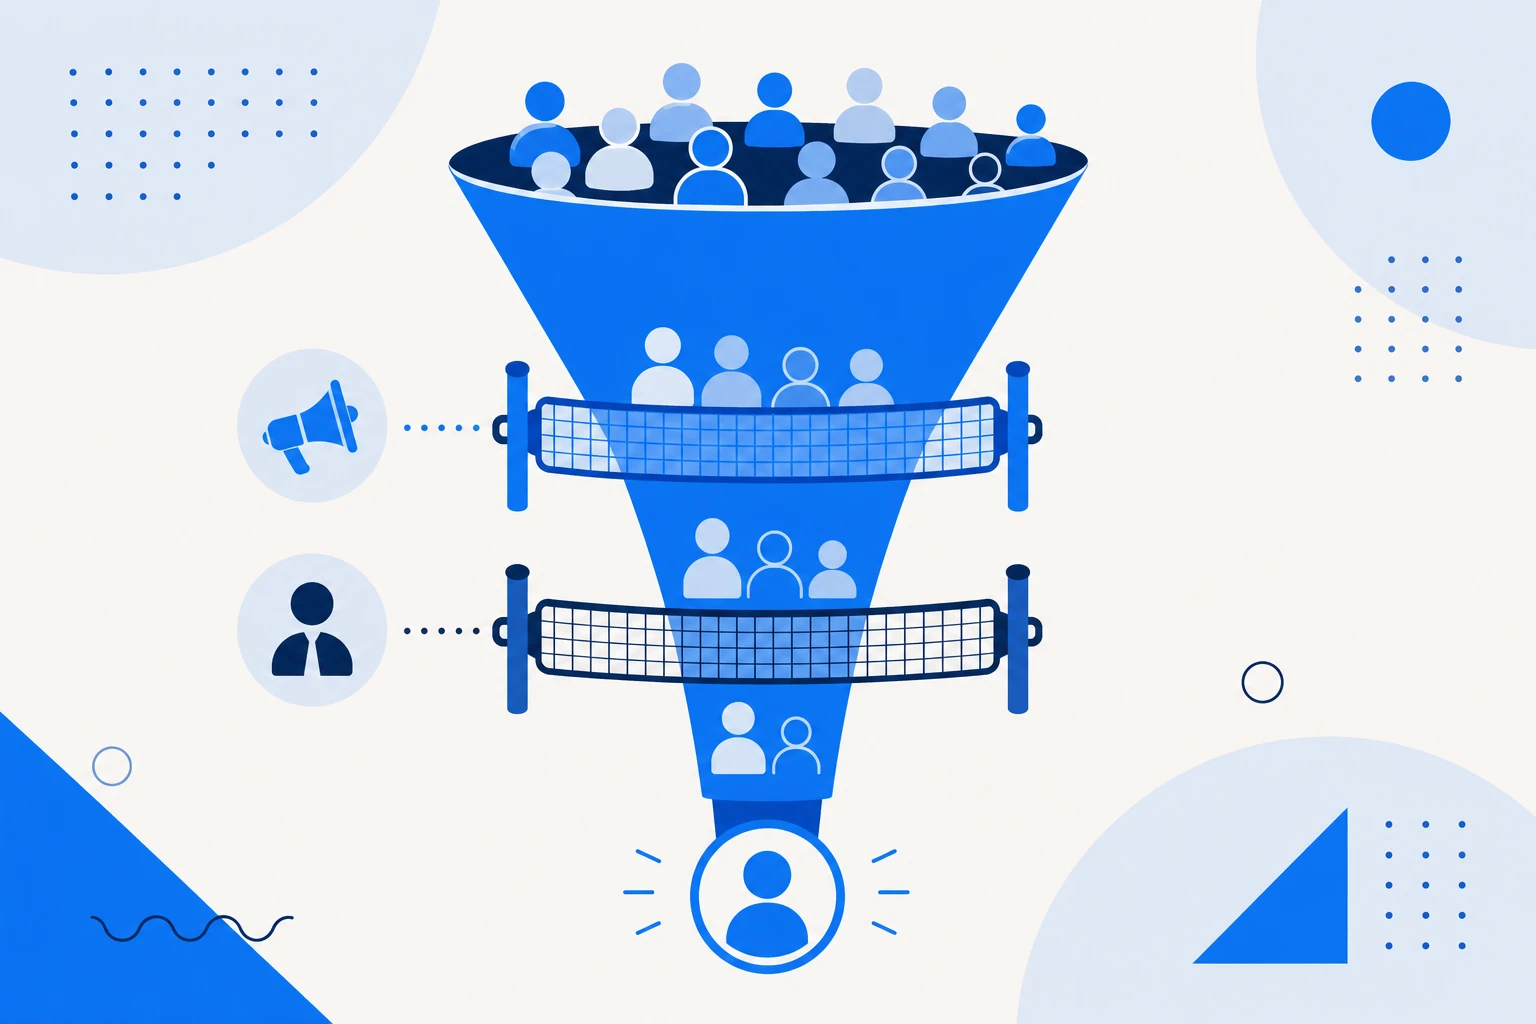
MQL (Marketing Qualified Lead) is the lead that marketing has qualified as interested enough to pass to sales; SQL (Sales Qualified Lead) is the lead that sales has validated as a real opportunity. They are successive stages of qualification in the funnel (Lead, MQL, SQL, Opportunity), and the MQL to SQL conversion rate measures alignment between the two teams.

Product Qualified Lead (PQL)
A Product Qualified Lead (PQL) is a lead qualified by product usage itself, not by marketing or sales. It is someone who reached a value milestone inside the tool, such as activating a core feature or hitting a usage limit, signaling real buying intent. It is the native lead of product-led growth and tends to convert far more than a lead qualified by profile alone.

Win rate
Win rate is the share of opportunities that turn into closed sales: deals won divided by the total deals closed (won plus lost) in a period. It measures commercial efficiency and the quality of the pipeline and qualification. A low win rate with high volume usually points to poorly qualified leads or weak fit, and raising the rate is one of the most direct ways to lower CAC.