
A/B testing: what it is, how to run one and how to read results
By Tiago Costa · Updated on July 9, 2026

Definition
A/B testing is an experiment that splits users between two versions, A and B, to measure which produces a better outcome and decide with data, not opinion.
- Compares a control version (A) with a variant (B).
- Needs enough sample and statistical significance.
- It is the engine of optimization in self-serve products.
What A/B testing is
A/B testing is a controlled experiment that splits users between two versions of the same screen, flow or message: version A, called the control, and version B, the variant. Each person sees only one of them, chosen at random, and the product measures which one produces a better outcome on a metric defined in advance, such as conversion, activation or engagement.
The core idea is to trade opinion for evidence. Instead of arguing which button, headline or price looks better, you let real user behavior decide. Because the two groups are statistically equivalent, any consistent difference in the outcome can be attributed to the change tested, not to chance.
How an A/B test works
Every A/B test starts with a clear hypothesis: a statement like "if I change X, then metric Y will improve, because Z". Without a hypothesis, the test becomes a random fishing trip and the result is hard to interpret.
- Hypothesis: define what changes, which metric you expect to move and why.
- Control and variant: keep A as it is and change only one thing in B, to isolate the effect.
- Random split: assign users at random between A and B, so the groups are comparable.
- Single metric: pick the primary success metric before you start, not after seeing the data.
With this structure, the test answers a question asked in advance. That is what separates an experiment from a layout swap made in the dark.

Sample size and statistical significance
The trickiest part of an A/B test is not mistaking luck for effect. With few users, a difference in outcome can be just noise: flip a coin ten times and getting seven heads is common without the coin being biased. That is why every test needs a sample size calculated before it starts.
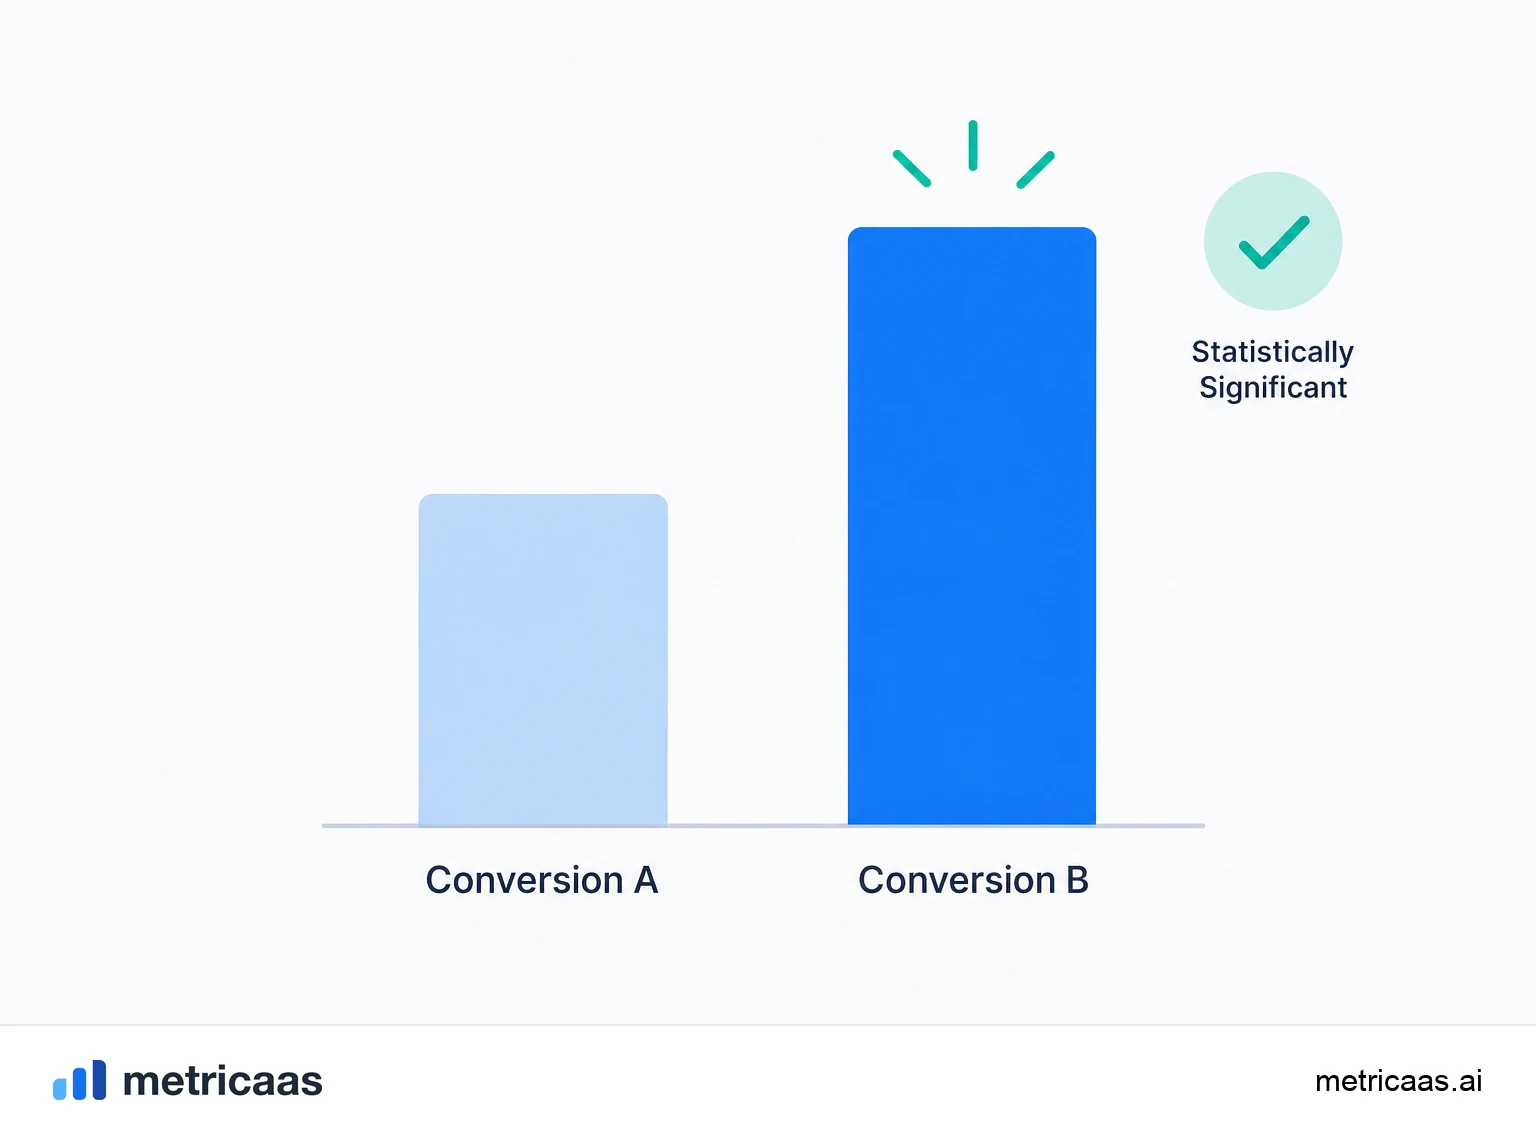
Statistical significance answers one question: how likely is it to see this difference if the two versions were actually identical? The common standard is to require 95% confidence, that is, to accept at most a 5% chance of a false positive. The smaller the effect you want to detect, the larger the sample needed. Running a test with too few users is the fastest way to make wrong decisions that look data-driven.
Common pitfalls in A/B testing
Most tests fail not because of the concept, but because of execution. The most common pitfalls come from looking at the result too early or measuring too many things at once.
- Peeking: checking the scoreboard every day and stopping the moment it turns "significant" inflates false positives.
- Stopping early: ending before you reach the planned sample turns noise into a conclusion.
- Multiple testing: tracking ten metrics at once almost guarantees one looks like a winner by chance.
- Contaminated sample: the same user seeing both versions, or seasonality and external campaigns, distort the comparison.
The most dangerous combination is peeking together with early stopping. Whoever checks the scoreboard many times and stops at the first favorable moment is, in practice, choosing the noise that confirms the expectation. The defense is simple: fix sample and duration before you start and only read the result at the end.
A/B testing in self-serve optimization
In self-serve products, A/B testing is the engine of continuous optimization. Because the user signs up, tries and subscribes without talking to sales, each stage of the funnel becomes a field for experiments: the onboarding that moves the Activation rate, the pricing page that moves the Trial-to-paid conversion and the flows that sustain the Engagement rate.
The trick is to keep tests anchored to what really matters. Optimizing an isolated click can lift a surface metric without moving anything deep. That is why the best teams connect every experiment to a North Star Metric, making sure local wins add real value. Public benchmarks, such as those from Benchmarkit, show how conversion and activation rates vary widely across companies, which reinforces why each product needs its own tests instead of copying someone else numbers.
A/B testing best practices
A good A/B testing program is more about discipline than about tools. Write the hypothesis down before you start, define a single success metric and calculate the sample size needed. That way, when the result arrives, it answers a question asked in advance, not a story assembled afterward.
- One change at a time: test a single isolated element so you know what caused the effect.
- Document everything: hypothesis, sample, duration and result, including the tests that failed.
- Respect the duration: run the test through full behavior cycles, covering weekdays and weekends.
Tests that showed no difference are wins too: they prevent useless changes and free the team from believing in improvements that do not exist. A mature experimentation culture celebrates the learning, not only the positive result.
Frequently asked questions
It means deciding with data instead of opinion: you compare two versions and measure which produces a better outcome in conversion, activation or engagement, attributing the difference to the change tested.
It is an experiment that randomly splits users between a control version (A) and a variant (B) to measure which one produces the better outcome on a chosen metric.
Form a hypothesis, change only one thing in the variant, split users at random, pick a primary metric and run until you reach the calculated sample, reading the result only at the end.
It is the statistical backbone of the test: you compare the hypothesis that both versions are equal against the data, and significance tells you how likely the observed difference is to be mere chance.
It depends on the effect size you want to detect: the smaller the expected difference, the larger the sample. The size should be calculated before you start, not estimated during the test.
Long enough to reach the planned sample and cover full behavior cycles, including weekdays and weekends. Stopping before that turns noise into a false conclusion.
Related concepts

Activation rate
Activation rate is the share of new users who reach the product first real value (the aha moment or setup milestone) within a defined time frame. It is the bridge between acquisition and retention: those who activate tend to stay, those who do not tend to churn. That makes it one of the strongest predictors of retention and the silent bottleneck of trial conversion in SaaS.

Trial-to-paid conversion
Trial-to-paid conversion is the share of free trials that become paying customers: paid conversions divided by trials started. It is the central metric of self-serve products and it varies widely depending on whether the trial requires a card (opt-out, roughly 40% to 60%) or not (opt-in, roughly 10% to 25%). Activation during the trial is the strongest predictor of who converts.

Engagement rate
Engagement rate measures how intensely the base uses the product: the share of users who perform the key value action in a period. There is no single formula, each product defines that action. High engagement precedes retention and expansion; low engagement precedes churn.