
Power users: quem são, como identificar e por que importam
Por Tiago Costa · Atualizado em 9 de julho de 2026

Definição
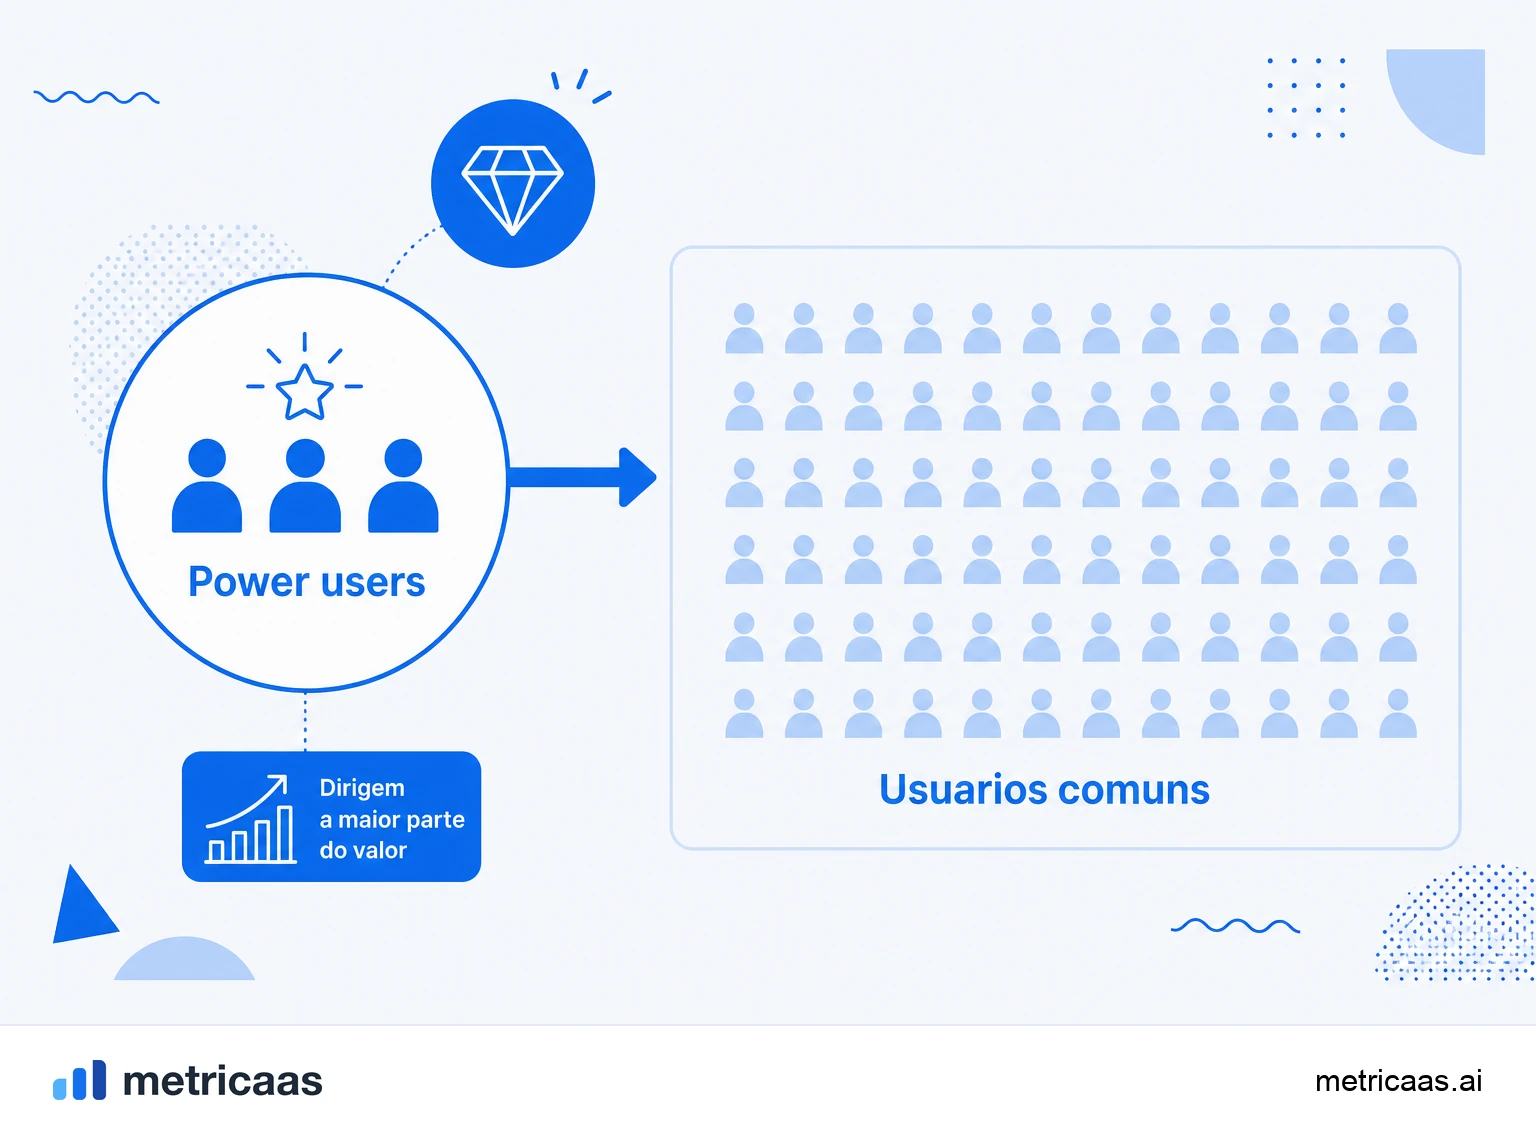
Power users são a fração pequena de usuários mais engajados de um SaaS, que usam o produto com mais profundidade e frequência e geram uma parcela desproporcional do valor.
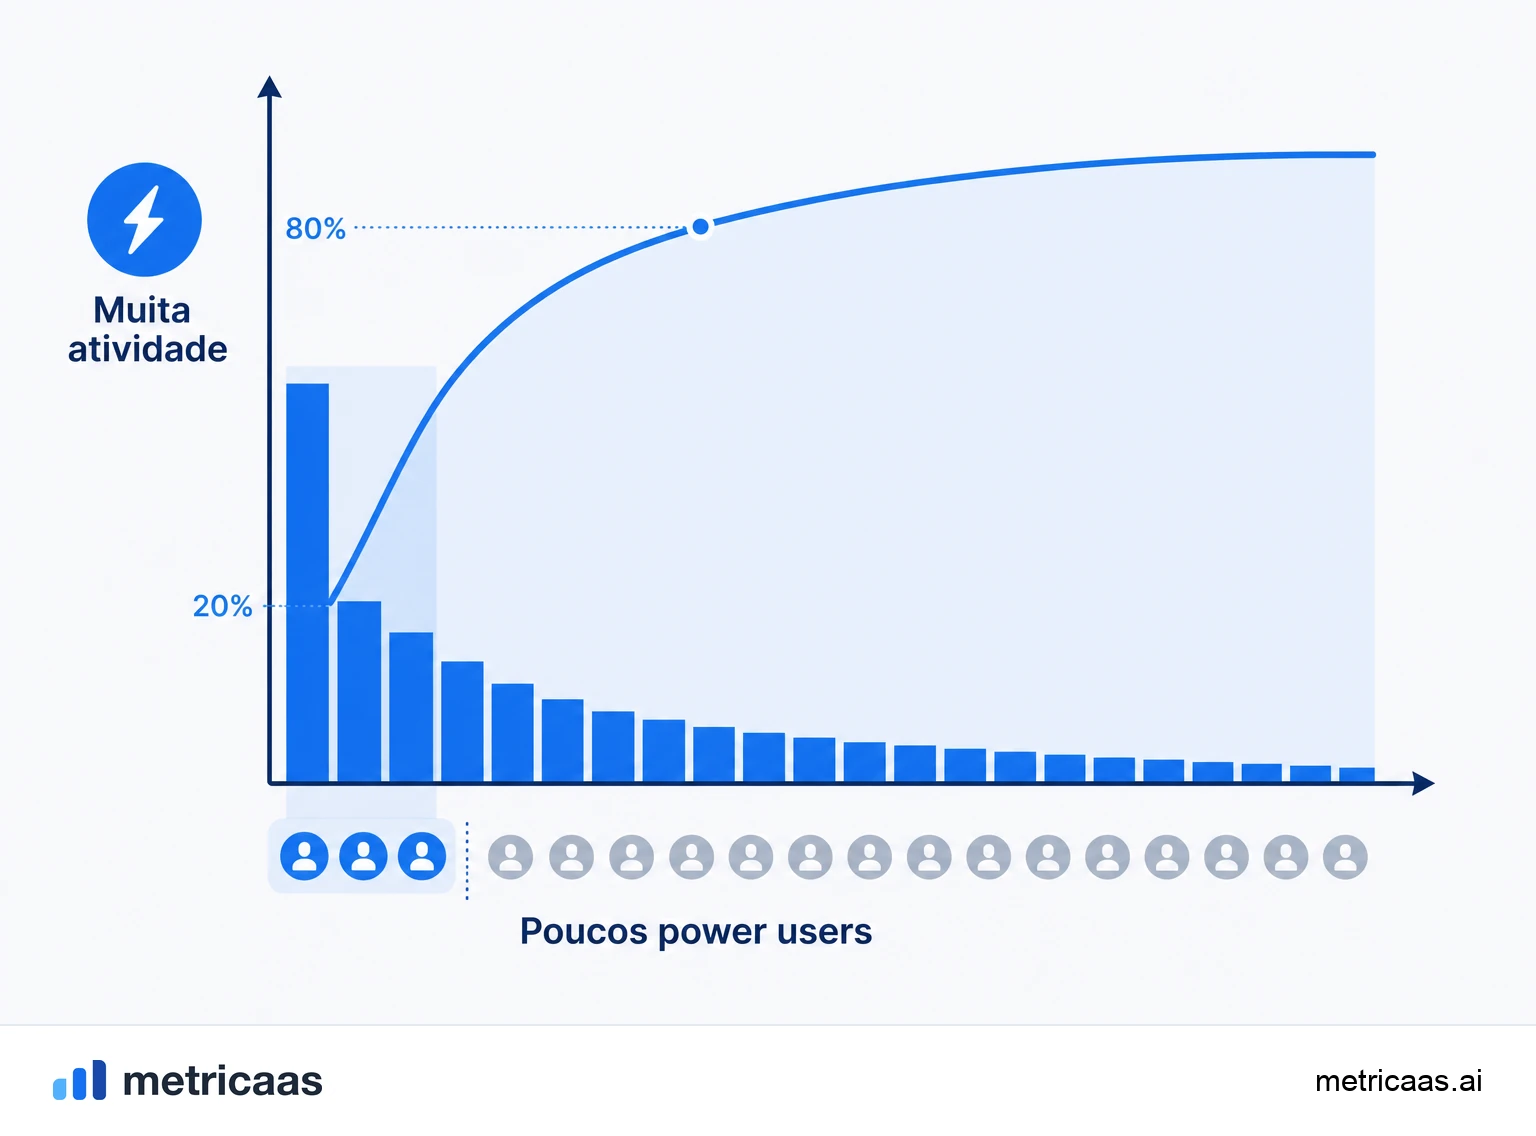
- Efeito Pareto: poucos usuários respondem por grande parte da atividade.
- Fonte de expansão de receita, indicações e feedback qualificado.
- Mapear o que os torna power users guia o roadmap e o onboarding.
O que são power users
Power users são os usuários que extraem o máximo de um produto: entram com frequência, usam recursos avançados, adotam mais fluxos do que a média e integram a ferramenta à rotina de trabalho. Não são necessariamente os que pagam mais, mas quase sempre são os que dependem mais do produto, e por isso os mais difíceis de perder.
O traço definidor é a intensidade da relação com o produto, não o cargo nem o plano. Um power user costuma ter tanto profundidade (usa recursos que a maioria ignora) quanto amplitude (aciona várias partes do produto) e frequência (volta muitas vezes por semana). É essa combinação que separa quem apenas mantém a conta ativa de quem realmente vive dentro da ferramenta.
Como identificar seus power users
Identificar power users é um exercício de dados, não de intuição. A base é observar comportamento ao longo do tempo e cruzar três dimensões: com que frequência a pessoa volta, quão fundo ela vai no produto e quantas ações relevantes realiza.
- Frequência: sessões por semana, dias ativos por mês, retorno consistente em vez de picos isolados.
- Profundidade: uso de recursos avançados, configurações, automações e integrações que a maioria nunca toca.
- Amplitude: número de módulos ou fluxos diferentes que a pessoa aciona.
- Ações de valor: eventos que representam o momento "aha" do produto, repetidos com regularidade.
Uma pista rápida é a razão DAU / MAU: usuários com stickiness muito acima da média do produto são candidatos naturais a power user. A partir daí, olhar a taxa de engajamento por conta ajuda a separar quem usa de verdade de quem só mantém login ativo.
Definir o limiar de power user
Não existe limiar universal: o que faz de alguém um power user depende do seu produto e do valor que ele entrega. O erro comum é copiar uma régua genérica ("usou 3 vezes na semana") sem verificar se ela realmente separa quem fica de quem some.
Um caminho sólido é definir o limiar pela correlação com retenção e receita. Olhe a distribuição de uso, encontre o ponto a partir do qual a curva de retenção dispara, e ancore ali. Em vez de escolher um número redondo, deixe os dados apontarem o corte.
- Escolha uma ou duas ações centrais que representem valor real, não vaidade.
- Fixe uma janela de tempo (por exemplo, por semana ou por mês) para medir a intensidade.
- Valide o corte checando se, acima dele, a retenção e a expansão de fato sobem.
- Revise o limiar conforme o produto evolui e novos recursos mudam o que significa "usar bem".
Por que os power users importam
Power users importam porque geram valor desproporcional. Vale aqui o efeito Pareto: uma fração pequena da base costuma responder por grande parte da atividade, da receita de expansão e das indicações. Perder um power user dói muito mais do que perder um usuário casual, tanto pela receita quanto pelo efeito em rede que ele sustenta.
- Expansão: são os que mais adotam recursos pagos, sobem de plano e adicionam assentos, elevando a Net Revenue Retention (NRR).
- Indicação: viram promotores naturais, trazem colegas e novas contas com custo de aquisição baixo.
- Retenção: por dependerem do produto, têm o menor churn e ancoram a receita recorrente.
- Feedback: dão o retorno mais qualificado, porque conhecem os limites do produto na prática.
Como power users guiam roadmap e onboarding
Além de sustentarem a receita, os power users são um mapa. Estudar o que eles fazem revela quais recursos entregam valor de verdade e qual sequência de ações leva alguém a ficar. Esse padrão vira a espinha dorsal do roadmap e do onboarding.
A ideia é engenharia reversa do sucesso: descubra os hábitos que separam um power user de um usuário morno e desenhe o onboarding para levar o novato àqueles hábitos o mais rápido possível. Se power users sempre configuram uma integração na primeira semana, essa integração deve virar um passo guiado para todo mundo. Priorize no roadmap o que aprofunda o uso de quem já ama o produto, sem perder de vista o que destrava os demais.
Métricas para acompanhar power users
Acompanhar power users exige olhar engajamento e receita juntos, porque um sem o outro engana. Um bom painel combina intensidade de uso com o impacto financeiro dessa intensidade.
- Stickiness (DAU / MAU): mostra quantos usuários voltam quase todo dia, o coração do comportamento power.
- Taxa de engajamento: fração da base que realiza as ações de valor no período.
- Net Revenue Retention (NRR): captura a expansão que os power users puxam.
- Churn do segmento: acompanhado à parte, deve ser bem menor no grupo power.
Benchmarks de SaaS, como os compilados pela Benchmarkit em sua pesquisa anual, mostram que a expansão vinda da base existente é um dos maiores motores de crescimento, e são os power users que a sustentam. Ler essas métricas por segmento, e não só no agregado, é o que transforma o conceito em decisão.
Perguntas frequentes
É o usuário mais engajado e frequente de um produto, que usa recursos avançados, integra a ferramenta à rotina e gera uma parcela desproporcional da atividade e do valor.
Cruzando dados de frequência (dias ativos), profundidade (recursos avançados) e amplitude de uso, e olhando quem realiza as ações de valor do produto com regularidade. A razão DAU / MAU é um bom ponto de partida.
O usuário comum mantém a conta ativa e usa o básico; o power user vai fundo, adota recursos avançados, volta com mais frequência e depende do produto, o que o torna mais difícil de perder.
Superusuário e administrador são papéis de permissão, definidos pelo acesso que a pessoa tem. Power user é um comportamento, definido pela intensidade de uso. Um admin pode não ser power user, e vice-versa.
Escolha uma ou duas ações centrais de valor, fixe uma janela de tempo e ancore o corte no ponto em que a retenção e a expansão disparam. Deixe os dados definirem o número, em vez de copiar uma régua genérica.
Porque geram valor desproporcional: puxam a expansão de receita, trazem indicações, têm o menor churn e dão o feedback mais qualificado. Estudá-los guia o roadmap e o onboarding dos demais.
Conceitos relacionados

DAU / MAU
DAU e MAU são os usuários ativos diários (Daily Active Users) e mensais (Monthly Active Users) de um produto. A razão DAU/MAU, obtida dividindo o DAU médio pelo MAU, é a métrica de stickiness: mostra que fração dos usuários mensais volta num dia típico. Perto de 50% indica um produto de uso diário; um índice baixo indica uso ocasional. O número só faz sentido se "ativo" for definido de forma honesta.

Taxa de engajamento
A taxa de engajamento mede a intensidade com que a base usa o produto: a fração de usuários que realiza a ação-chave de valor num período. Não há fórmula única, cada produto define essa ação. Alto engajamento antecede retenção e expansão; baixo engajamento antecede churn.

Net Revenue Retention (NRR)
Net Revenue Retention (NRR), ou retenção líquida de receita, mede quanto da receita recorrente da sua base atual você mantém ao longo do tempo, já considerando upgrades e expansões, menos downgrades e cancelamentos. Acima de 100% significa que a base cresce sozinha, mesmo sem clientes novos.