
NPS: o que é o Net Promoter Score e como calcular
Por Tiago Costa · Atualizado em 9 de julho de 2026

Definição
NPS (Net Promoter Score) é um índice de lealdade calculado a partir da pergunta "de 0 a 10, o quanto você recomendaria?".
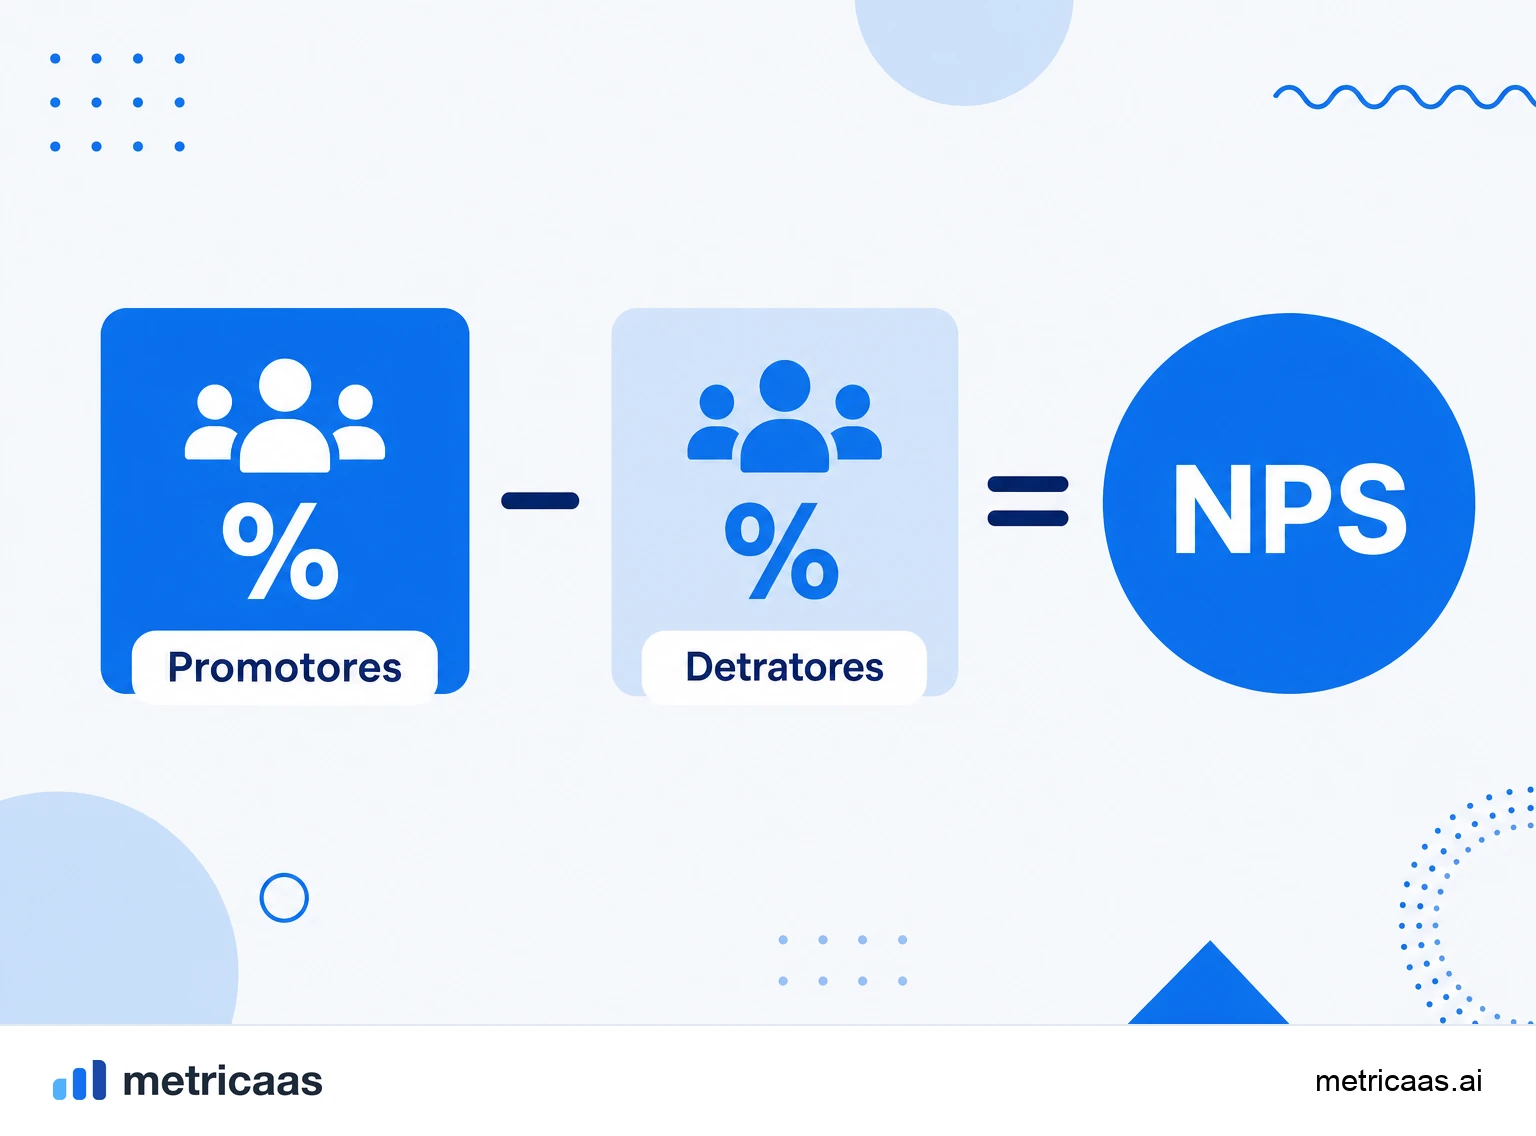
- NPS = % de promotores (9-10) menos % de detratores (0-6).
- Os neutros (7-8) entram na base, mas não somam nem subtraem.
- Varia de -100 a +100 e mede lealdade, não satisfação pontual.
O que é o NPS
O NPS (Net Promoter Score) é um índice de lealdade que resume, num único número, a disposição dos clientes de recomendar uma empresa, produto ou serviço. Ele nasce de uma pergunta só: "de 0 a 10, o quanto você recomendaria a um amigo ou colega?". A partir dessa nota, cada cliente cai em um de três grupos, e o placar final vai de -100 a +100.
A métrica foi popularizada por Fred Reichheld, da consultoria Bain & Company, em parceria com a Satmetrix, sobre uma tese simples: a recomendação espontânea é um forte sinal de lealdade, porque só recomendamos aquilo em que confiamos o suficiente para colocar nossa reputação em jogo. Por isso o NPS mede lealdade e boca a boca, e não a satisfação com um atendimento específico, que é o território do CSAT.
Como calcular o NPS
O cálculo tem duas etapas. Primeiro, classifique cada resposta pela nota; depois, subtraia a porcentagem de detratores da porcentagem de promotores. Os neutros entram na base total, mas não somam nem subtraem no resultado.
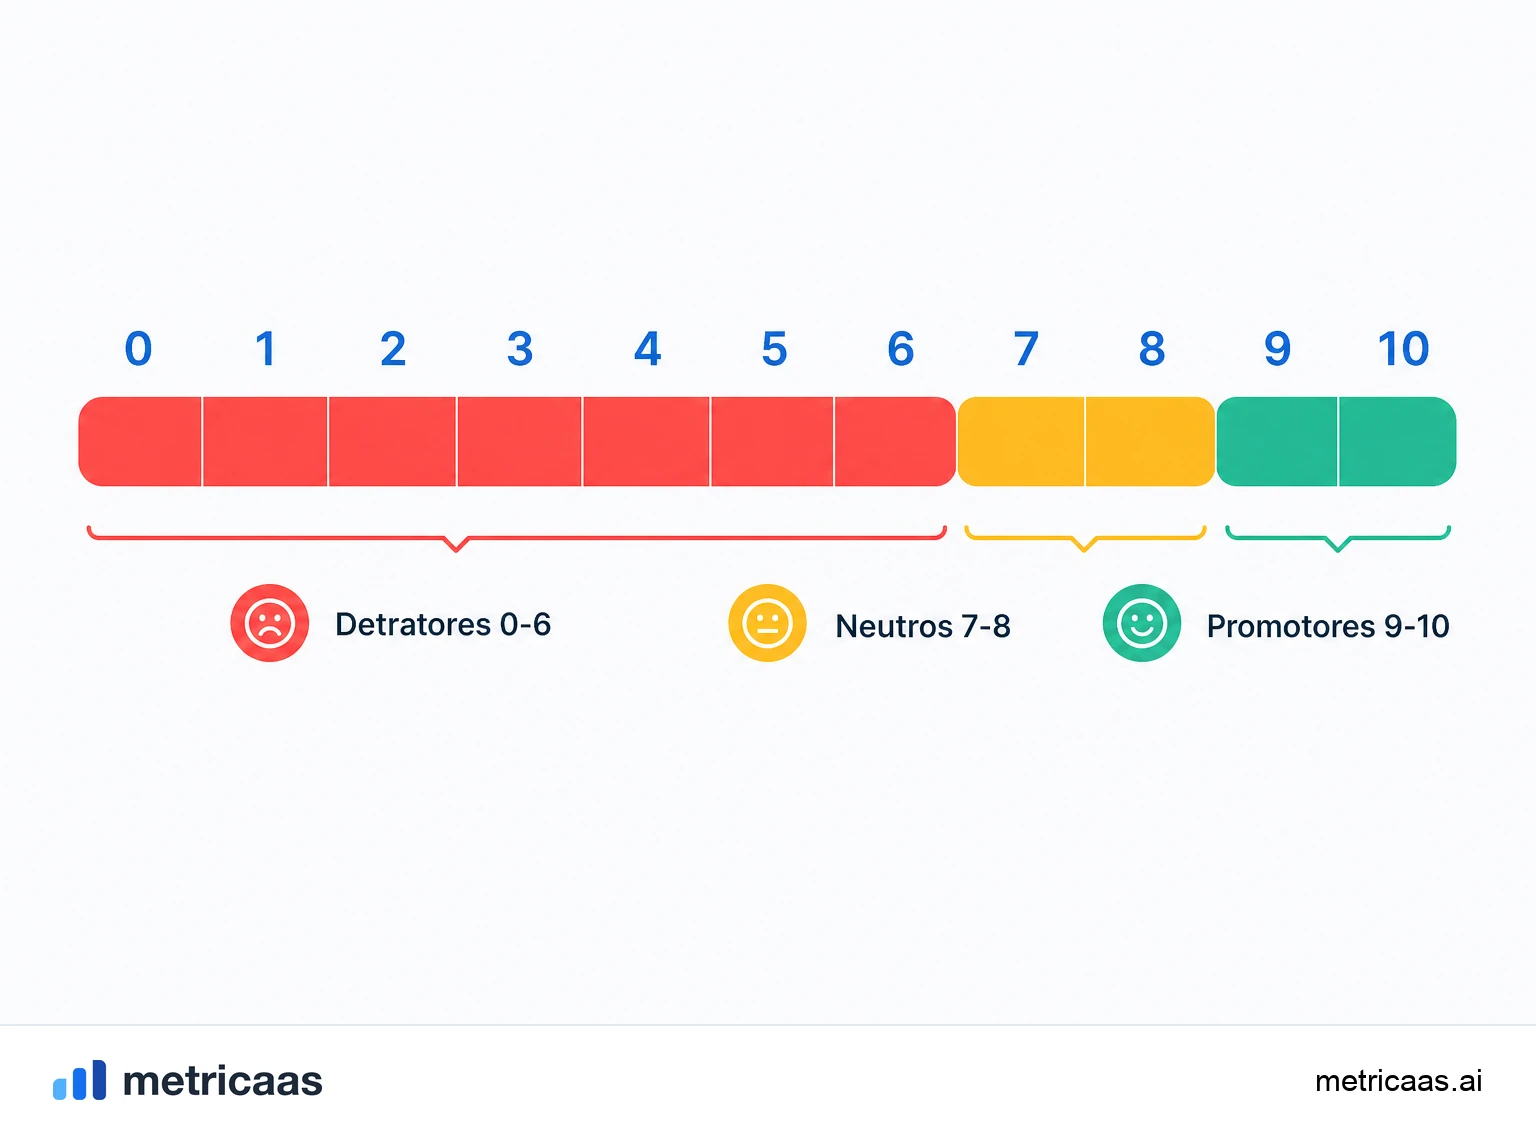
- Promotores: notas 9 e 10.
- Neutros (passivos): notas 7 e 8.
- Detratores: notas de 0 a 6.
NPS = % de promotores menos % de detratores. Exemplo: em 200 respostas, 120 promotores (60%), 50 neutros (25%) e 30 detratores (15%). O NPS é 60 menos 15, ou seja, 45. O resultado é sempre um número inteiro entre -100 (todos detratores) e +100 (todos promotores), e por convenção se escreve sem o sinal de porcentagem.
Promotores, neutros e detratores
Os três grupos não são rótulos arbitrários, eles descrevem comportamentos distintos. Os promotores (9-10) são leais e entusiastas: tendem a comprar mais, permanecer por mais tempo e trazer novos clientes pelo boca a boca. Os detratores (0-6) estão insatisfeitos, podem falar mal da marca e concentram grande parte do risco de churn.
Os neutros (7-8) são clientes satisfeitos, porém sem lealdade: gostam o suficiente para ficar, mas não a ponto de recomendar, e trocam de fornecedor com facilidade diante de uma oferta melhor. Eles ficam de fora do cálculo justamente porque o NPS quer medir os extremos de lealdade, e não o meio-termo morno. Ignorar os neutros no resultado, mas acompanhá-los na base, ajuda a enxergar quantos clientes estão a um passo de virar promotores ou detratores.
NPS relacional e transacional
Existem duas formas de aplicar a pesquisa, e elas respondem a perguntas diferentes. O NPS relacional mede a percepção geral sobre a marca e costuma ser enviado em intervalos fixos (por exemplo, a cada trimestre), independente de uma interação recente. Ele serve para acompanhar a lealdade ao longo do tempo e comparar períodos.
O NPS transacional é disparado logo após um evento específico, como uma compra, um chamado de suporte ou o onboarding, e mede a experiência daquele momento. Enquanto o relacional responde "como está a nossa relação?", o transacional responde "como foi esta interação?". Empresas maduras usam os dois: o relacional para o pulso da base, o transacional para achar os pontos exatos da jornada que geram promotores ou detratores.
NPS, CSAT e CES: o que cada métrica mede
NPS, CSAT e CES são as três métricas clássicas de experiência do cliente, e se confundem com facilidade. O NPS mede lealdade e propensão a recomendar, uma visão de relacionamento de longo prazo. O CSAT mede a satisfação pontual com uma interação ou produto específico, geralmente logo depois que ela acontece. O CES mede o esforço que o cliente precisou fazer para resolver algo.
- NPS: "você recomendaria?", lealdade e boca a boca no longo prazo.
- CSAT: "você ficou satisfeito?", satisfação imediata com um ponto de contato.
- CES: "foi fácil resolver?", atrito e esforço do cliente.
Nenhuma substitui a outra. O NPS diz se a relação está saudável, o CSAT e o CES apontam onde, na jornada, a experiência melhora ou piora.
Limites do NPS e o que é um bom número
Não existe um NPS universalmente "bom": o que é excelente num setor pode ser mediano em outro, e comparações entre indústrias ou entre países enganam, porque a cultura influencia a forma de dar notas. Como regra geral, um NPS positivo (acima de zero) indica mais promotores que detratores, e placares acima de 50 costumam ser considerados fortes, mas o mais útil é comparar o seu número com o seu próprio histórico e com concorrentes diretos.
O NPS também tem limites conhecidos. Por ser um número único, ele diz "quão leais" os clientes são, mas não "por quê", então só rende quando acompanhado da pergunta aberta que explica a nota. Ele é sensível a quem responde e a como a pesquisa é feita, e não deve ser lido isoladamente. Por isso costuma entrar como um dos sinais de um customer health score, ao lado de uso do produto e suporte, e ser cruzado com o churn real para virar ação, e não só um placar de vaidade.
Perguntas frequentes
NPS significa Net Promoter Score, um índice de lealdade baseado na pergunta "de 0 a 10, o quanto você recomendaria?". Mede a propensão dos clientes a recomendar a marca.
Depende do setor. Um NPS positivo (acima de zero) já indica mais promotores que detratores, e placares acima de 50 costumam ser fortes. O ideal é comparar com o seu próprio histórico e com concorrentes diretos.
Subtraia a porcentagem de detratores (notas 0 a 6) da porcentagem de promotores (notas 9 e 10). Os neutros (7 e 8) entram na base, mas não contam no resultado. O NPS varia de -100 a +100.
O NPS mede lealdade e propensão a recomendar, uma visão de longo prazo. O CSAT mede a satisfação pontual com uma interação ou produto específico, logo depois que acontece.
Promotores (notas 9 e 10), neutros ou passivos (notas 7 e 8) e detratores (notas de 0 a 6). Só promotores e detratores entram no cálculo.
Sim, é um KPI de lealdade e experiência do cliente. Rende mais quando usado junto de outras métricas, como churn e uso do produto, e não isolado.
Conceitos relacionados

CSAT
CSAT (Customer Satisfaction Score) é a métrica que mede a satisfação do cliente com uma interação, produto ou momento específico, calculada como as respostas satisfeitas divididas pelo total, em percentual. É pontual e transacional, capta o sentimento no calor do momento, ao contrário do NPS, que mede lealdade de longo prazo, e do CES, que mede o esforço. Cada ponto de contato pode ter o seu próprio CSAT.

CES
CES (Customer Effort Score) é a pontuação de esforço do cliente: mede quanto trabalho a pessoa precisou ter para concluir uma tarefa com a empresa, resolver um chamado, ativar um recurso ou finalizar uma compra. A pergunta típica é "quão fácil foi?". Baixo esforço prevê lealdade melhor do que tentar encantar, e por isso o CES complementa o NPS e o CSAT.

Churn
Churn é a perda de clientes ou de receita num período. Num SaaS, ele mede quantos clientes cancelam (churn de clientes) ou quanto de receita recorrente desaparece (churn de receita). É a métrica que revela se o crescimento se sustenta: quanto mais alto o churn, mais novas vendas você precisa só para não encolher.