
Uptime: what service availability is and how to calculate it
By Tiago Costa · Updated on July 9, 2026
Definition
Uptime is the percentage of time a service is available and working over a period, the heart of any SLA.
- Usually expressed in "nines": 99%, 99.9%, 99.99%.
- Each extra nine sharply cuts the tolerated downtime.
- Low uptime erodes trust and drives churn up.
What uptime is
Uptime is the percentage of time a service is available and working within a period. In SaaS, it measures the share of the month or year in which the product responded as it should, with no outages or interruptions that stop the customer from using it. The higher the uptime, the more reliable the service has proven to be.
The opposite of uptime is downtime, the time the service was down or degraded. That is why uptime is usually read alongside the allowed downtime: a number that looks very high, like 99%, still leaves room for several days of outage over a year.
How uptime is calculated
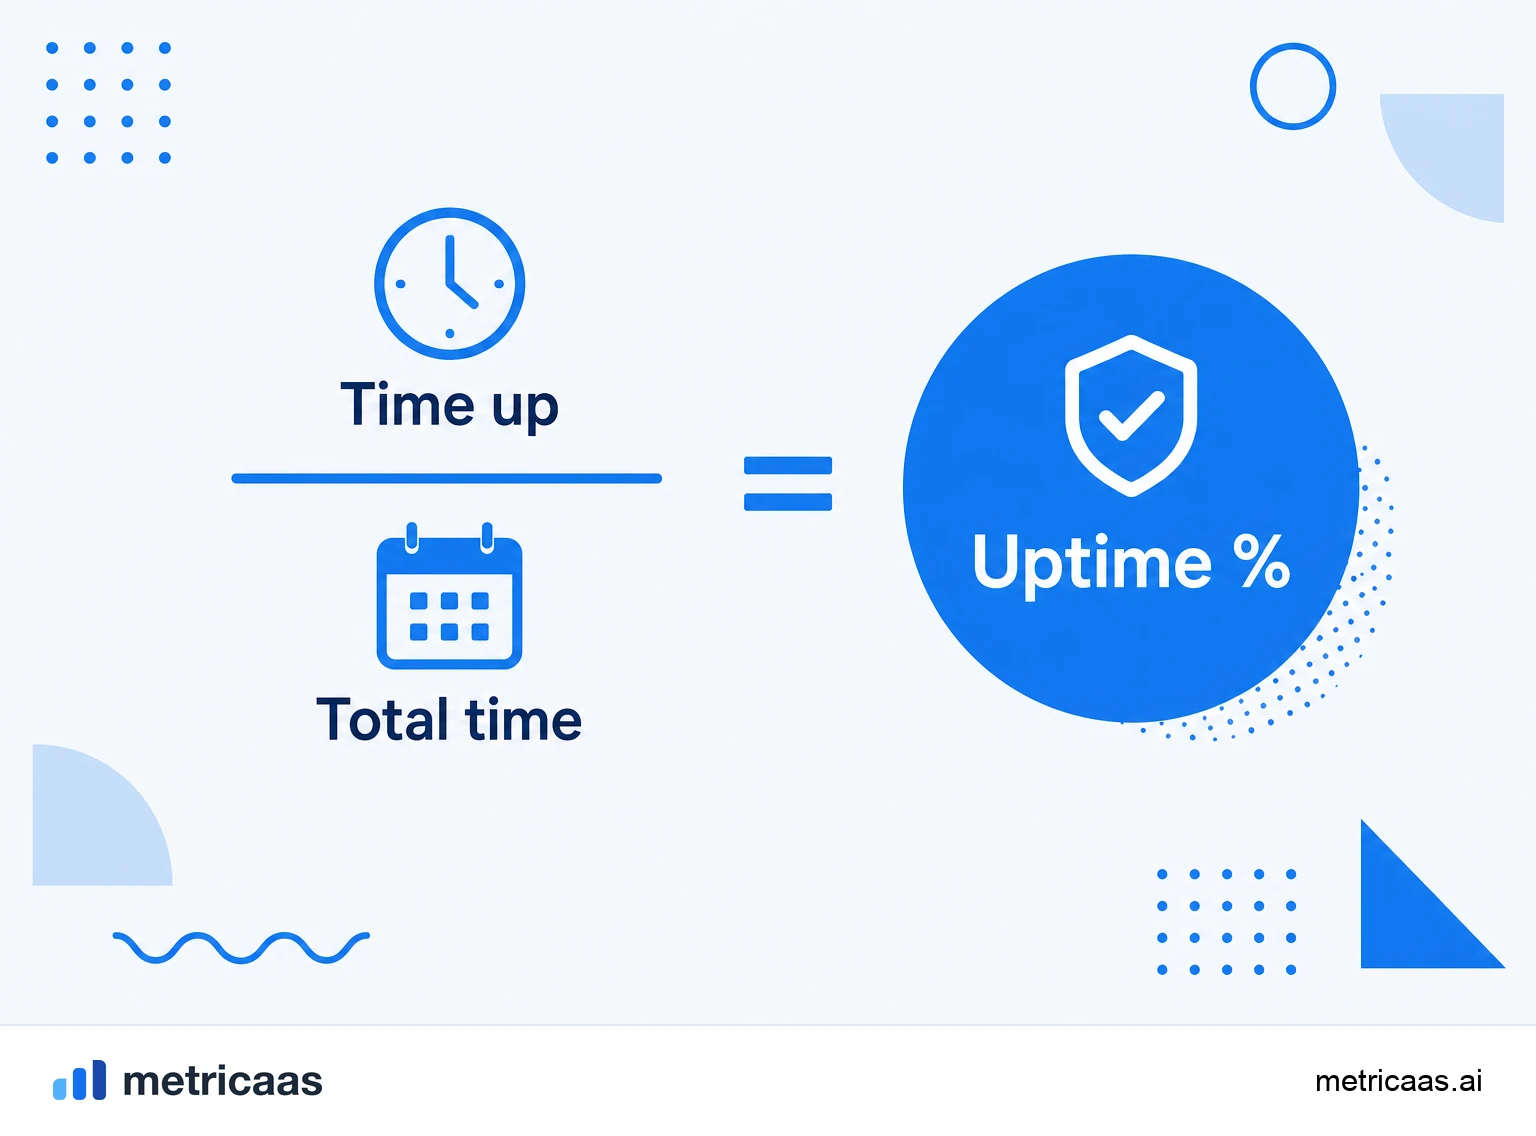
The math is a simple division: the time the service was available divided by the total time in the period, multiplied by 100.
- Uptime (%) = (available time / total time) x 100.
- Total time is the measured window, for example the 43,200 minutes in a 30-day month.
- Available time is that total minus the recorded downtime minutes.
Example: if in a 30-day month the service was down for 20 minutes, uptime was (43,180 / 43,200) x 100, or about 99.95%. The tricky part is defining what counts as downtime: only a full outage, or also the slowness that gets in the way of usage? That definition must be clear before comparing numbers.
The "nines": how much downtime each level allows
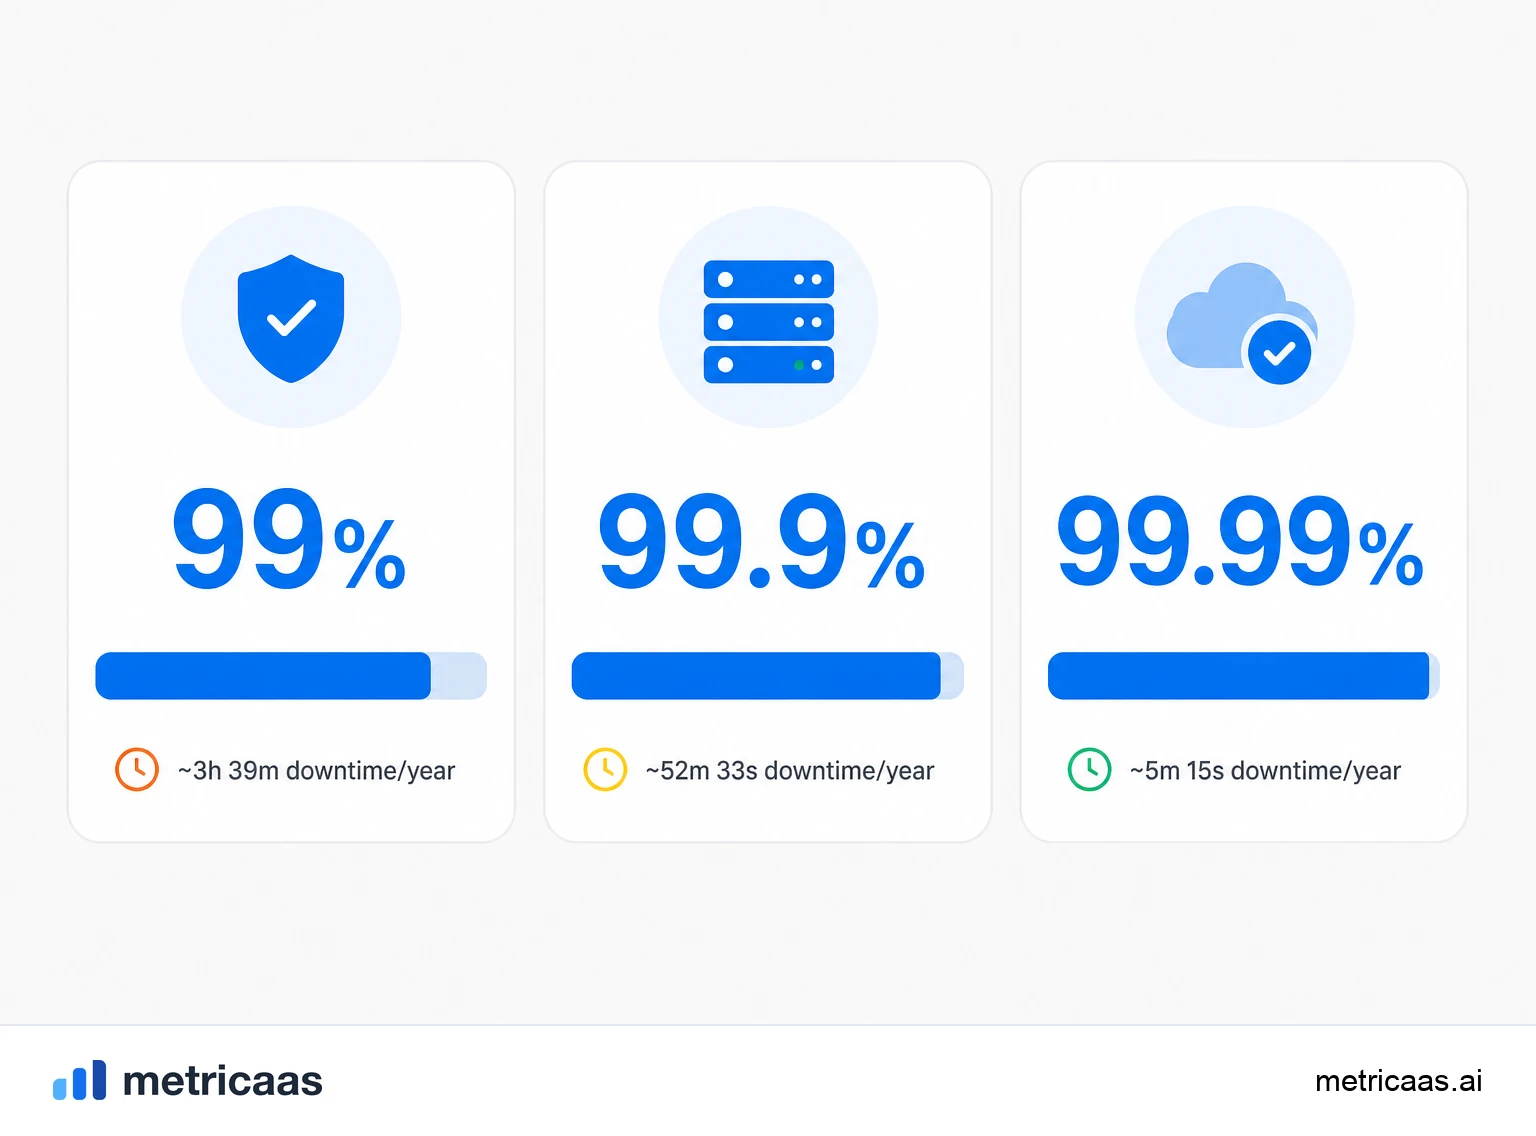
Uptime is usually expressed in "nines", and each extra nine drastically cuts the tolerated downtime. The gap between 99% and 99.9% looks small on paper, but it is days versus hours of outage per year.
- 99%: about 3.65 days of downtime per year.
- 99.9% (three nines): about 8.8 hours per year.
- 99.99% (four nines): about 52 minutes per year.
- 99.999% (five nines): about 5 minutes per year.
So promising "high uptime" is not enough: the exact number decides whether the customer accepts minutes or days of interruption. Each extra nine, however, costs more and more in redundancy and engineering, so the target has to make sense for the kind of product.
Uptime and SLA: the contractual promise
Uptime is the heart of an SLA, the service level agreement in which the vendor formally promises a level of availability. When the SLA says "99.9% monthly uptime", it is fixing the maximum acceptable downtime and, almost always, what happens if that promise is broken.
In practice, the SLA turns uptime into a contractual commitment, with consequences:
- It defines the measurement window (monthly, quarterly) and what counts as an outage.
- It usually provides credits or refunds when uptime falls below what was promised.
- It is the reference the customer uses to hold the vendor accountable and the vendor uses to prioritize reliability.
Uptime, trust and churn
Availability is trust. Every visible outage erodes the sense that the product can be relied on, and lost trust tends to turn into cancellation. A track record of instability shows up early in the signs of dissatisfaction and pushes churn up, even when the product is good in every other way.
As dependence on cloud services grows, the cost of every hour offline rises: according to Gartner, worldwide public cloud spending is set to pass $700 billion in 2025. That is why repeated outages weigh on the customer health score and flag the risk of loss even before the customer complains.
How to monitor and improve uptime
Improving uptime starts with measuring it independently, with external monitoring that checks the service from the outside and records every interruption. Without that continuous measurement, the number becomes a guess, and a guess cannot back an SLA.
- Monitor from multiple regions and alert at the first sign of an outage.
- Remove single points of failure with redundancy and failover.
- Measure recovery time too, not just how often outages happen.
In the end, uptime is not an isolated engineering target: it is a direct driver of retention. A stable service is one where the customer never notices there is a number behind it, and that invisibility is exactly what sustains long-term trust.
Frequently asked questions
Uptime is the percentage of time a service is available and working within a period. The higher it is, the more reliable the service has proven to be.
The "five nines" allow about 5 minutes of downtime per year. It is one of the most demanding reliability levels and costs a lot in redundancy.
Uptime is the time a service was available; downtime is the time it was offline or degraded. Together they cover the whole measured period.
It is checking the service continuously and externally to record every outage and measure real availability. Without it, uptime is just an estimate and cannot back an SLA.
It depends on the product, but critical SaaS usually promise 99.9% or more in the SLA. What matters is that the target fits the use and is written into the contract.
It is the metric that expresses availability as a percentage, almost always in "nines": 99%, 99.9% or 99.99%. It sums up how long the service was up against the total period.
Related concepts

SLA
An SLA (Service Level Agreement) is the contractual commitment between a SaaS vendor and the customer about service quality: guaranteed uptime, support response time and the penalties or credits owed if the targets are missed. It gives the customer predictability, is decisive in enterprise deals and becomes a selling point. It differs from the SLO, the internal target, and the SLI, the indicator actually measured.
Churn
Churn is the loss of customers or revenue in a period. In a SaaS, it measures how many customers cancel (customer churn) or how much recurring revenue disappears (revenue churn). It is the metric that reveals whether growth is sustainable: the higher the churn, the more new sales you need just to avoid shrinking.
Customer health score
A customer health score is a composite score that estimates the health and risk of each customer by combining signals of product usage, engagement, support and payment. It exists to act before churn and to prioritize the accounts with the most value at risk. It is not a magic number, but a method to turn scattered signals into a single, actionable reading.