
ARR per employee: what it is and how to measure SaaS efficiency
By Tiago Costa · Updated on July 9, 2026

Definition
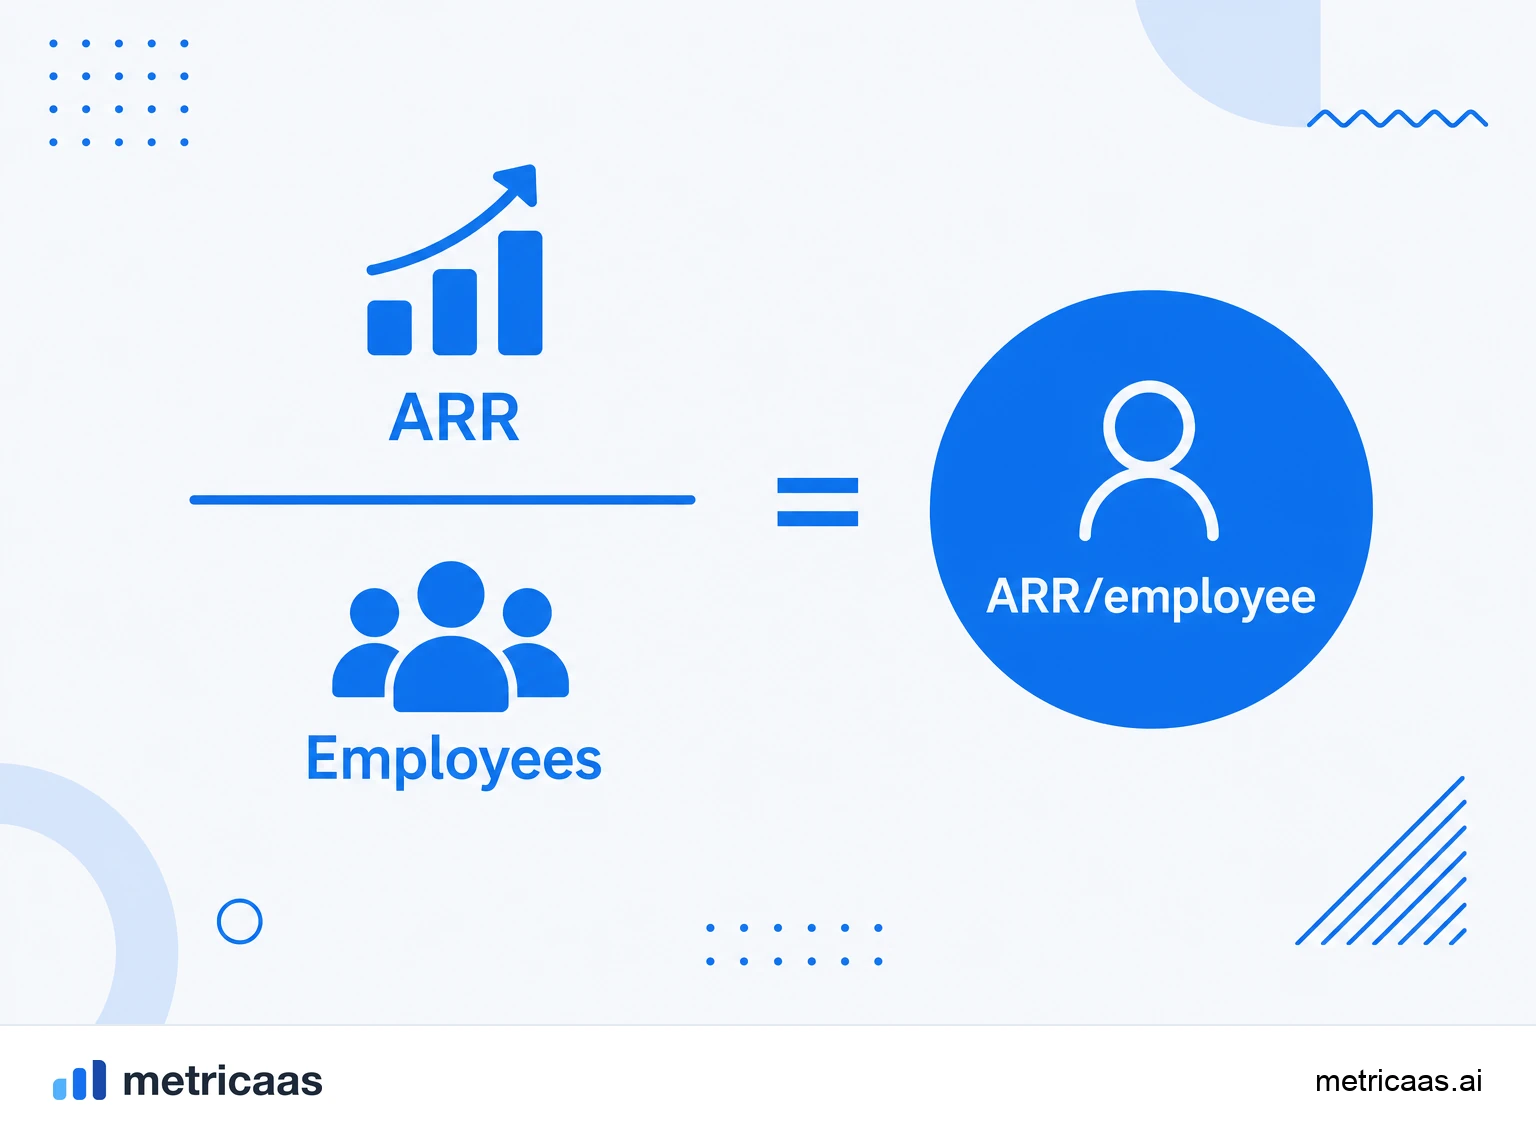
ARR per employee is ARR divided by the total number of employees in the company.
- Measures how much recurring revenue each person sustains.
- It is an indicator of capital efficiency and productivity.
- It rises when the company scales and automates processes.
What ARR per employee is
ARR per employee shows how much annual recurring revenue each person in the company sustains, on average. It takes total ARR and divides it by headcount, turning team size into an efficiency test: a SaaS that generates a lot of ARR with a lean team is putting its human capital to good use.
That is why the metric became a productivity gauge. It does not tell you whether the product is good or the margin is high, but it reveals whether the company needs a lot of people to grow or can scale revenue without bloating payroll. Product-led, well-automated teams tend to show a higher ARR per employee.
How to calculate ARR per employee
The formula is straightforward: divide ARR by headcount at the same point in time.
- ARR per employee = ARR / number of employees.
- Use normalized ARR, counting only recurring revenue from active subscriptions.
- Count headcount consistently, deciding whether to include only full-time staff or also contractors and part-timers.
Example: a company with $10 million in ARR and 50 employees has $200k of ARR per employee. The main caution is to always compare the same base over time, because batch hiring or an ARR spike distorts the reading from one month to the next.
What a good ARR per employee looks like
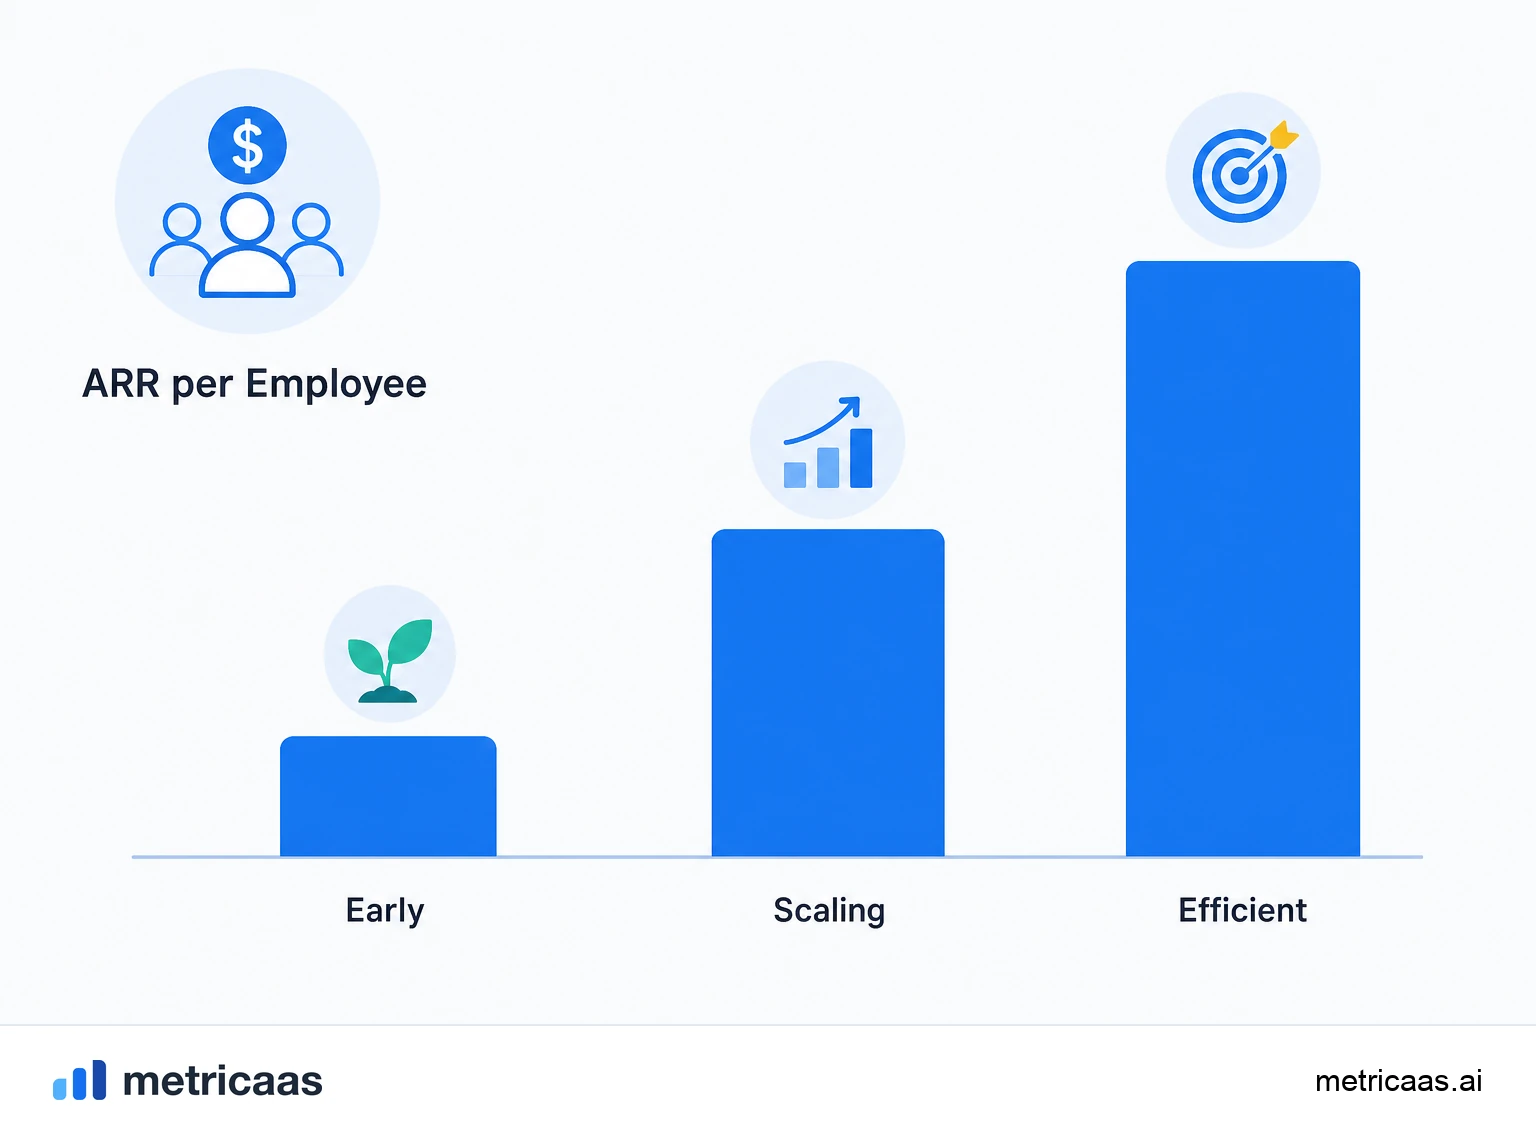
There is no universal magic number, because the healthy value depends on stage and model. Early-stage companies still hiring ahead of revenue tend to have a low ARR per employee; as they scale, the indicator usually climbs. As a reference, many mature and efficient SaaS operate in the range of hundreds of thousands per person.
Market surveys help calibrate the expectation. The annual private SaaS survey by KeyBanc Capital Markets tracks efficiency metrics such as revenue per employee, and the bar considered good has been rising as automation and AI let smaller teams sustain more revenue. Firms like Bessemer also treat per-person efficiency as a signal of business quality.
ARR per employee and the Rule of 40
ARR per employee is rarely read on its own. It speaks directly to the Rule of 40, which adds growth and margin to say whether a SaaS grows sustainably. A high ARR per employee is often the mechanism behind a good Rule of 40: when each person sustains a lot of revenue, there is margin left to grow without burning cash.
- High ARR per employee with strong growth signals efficient scaling.
- Low ARR per employee with fast growth suggests the team is bloating ahead of revenue.
- Flat ARR per employee is a sign the company has stopped gaining operating leverage.
What drives ARR per employee up
Raising this metric is almost never just about layoffs. The durable path is to make each person sustain more revenue, and that comes from three fronts: automating repetitive work, improving retention so you do not spend headcount recovering lost revenue, and gaining commercial efficiency. Metrics like the SaaS magic number help you see whether sales spend is generating enough new ARR.
Product-led models tend to start ahead because the product is part of acquisition and expansion, reducing dependence on large sales and support teams. The more growth comes from the product itself, the more ARR each employee can sustain.
Why investors watch ARR per employee
For investors, ARR per employee is a shortcut to judging capital discipline. It shows, in a single number, whether the company turns hires into recurring revenue or depends on growing the team to grow ARR. A high and rising value suggests a business that gains operating leverage over time.
That weighs on valuation. Because predictable ARR is the base of a SaaS value, companies that sustain more ARR per person tend to defend better multiples, since they promise more future revenue for every dollar spent on staff. That is why the metric appears alongside the Rule of 40 in fundraising conversations.
Frequently asked questions
It is ARR divided by the number of employees in the company. It measures how much recurring revenue each person sustains, working as an efficiency and productivity indicator.
Divide ARR by headcount. A company with $10 million in ARR and 50 employees has $200k of ARR per employee.
There is no universal number: it depends on stage and model. Mature, efficient SaaS often operate in the range of hundreds of thousands per person, and the bar considered good has been rising with automation.
FTE stands for full-time equivalent. ARR per FTE is the same idea as ARR per employee, but counting headcount in full-time equivalents rather than raw people.
The Rule of 40 uses the recurring revenue growth rate plus margin. ARR per employee is often the mechanism behind a good Rule of 40, because more revenue per person leaves more margin to grow.
Because it reveals whether the company grows with capital efficiency, turning hires into recurring revenue. A high and rising value helps defend a better valuation.
Related concepts

ARR
ARR (Annual Recurring Revenue) is the annual recurring revenue of a SaaS: MRR multiplied by 12. It represents how much the company earns on a recurring basis over a year, counting only active subscriptions, with no one-off charges. It is the metric of choice for companies selling annual contracts and the standard language of investors.

Rule of 40
The Rule of 40 is a health check for SaaS companies that adds the revenue growth rate to the profit margin: the result should be 40% or higher. It balances two goals that usually compete, growing fast and turning a profit, into a single number. Above 40 the business combines growth and profitability sustainably; below it, a warning light comes on.

SaaS magic number
The SaaS magic number is a sales and marketing efficiency metric. It divides the new ARR generated in a period by the sales and marketing (S&M) spend of the prior period. Above 1 is excellent and lets you accelerate investment, between 0.5 and 1 is healthy, and below 0.5 raises an efficiency warning.