
CES: o que é o Customer Effort Score e como calcular
Por Tiago Costa · Atualizado em 9 de julho de 2026

Definição
O que é o Customer Effort Score
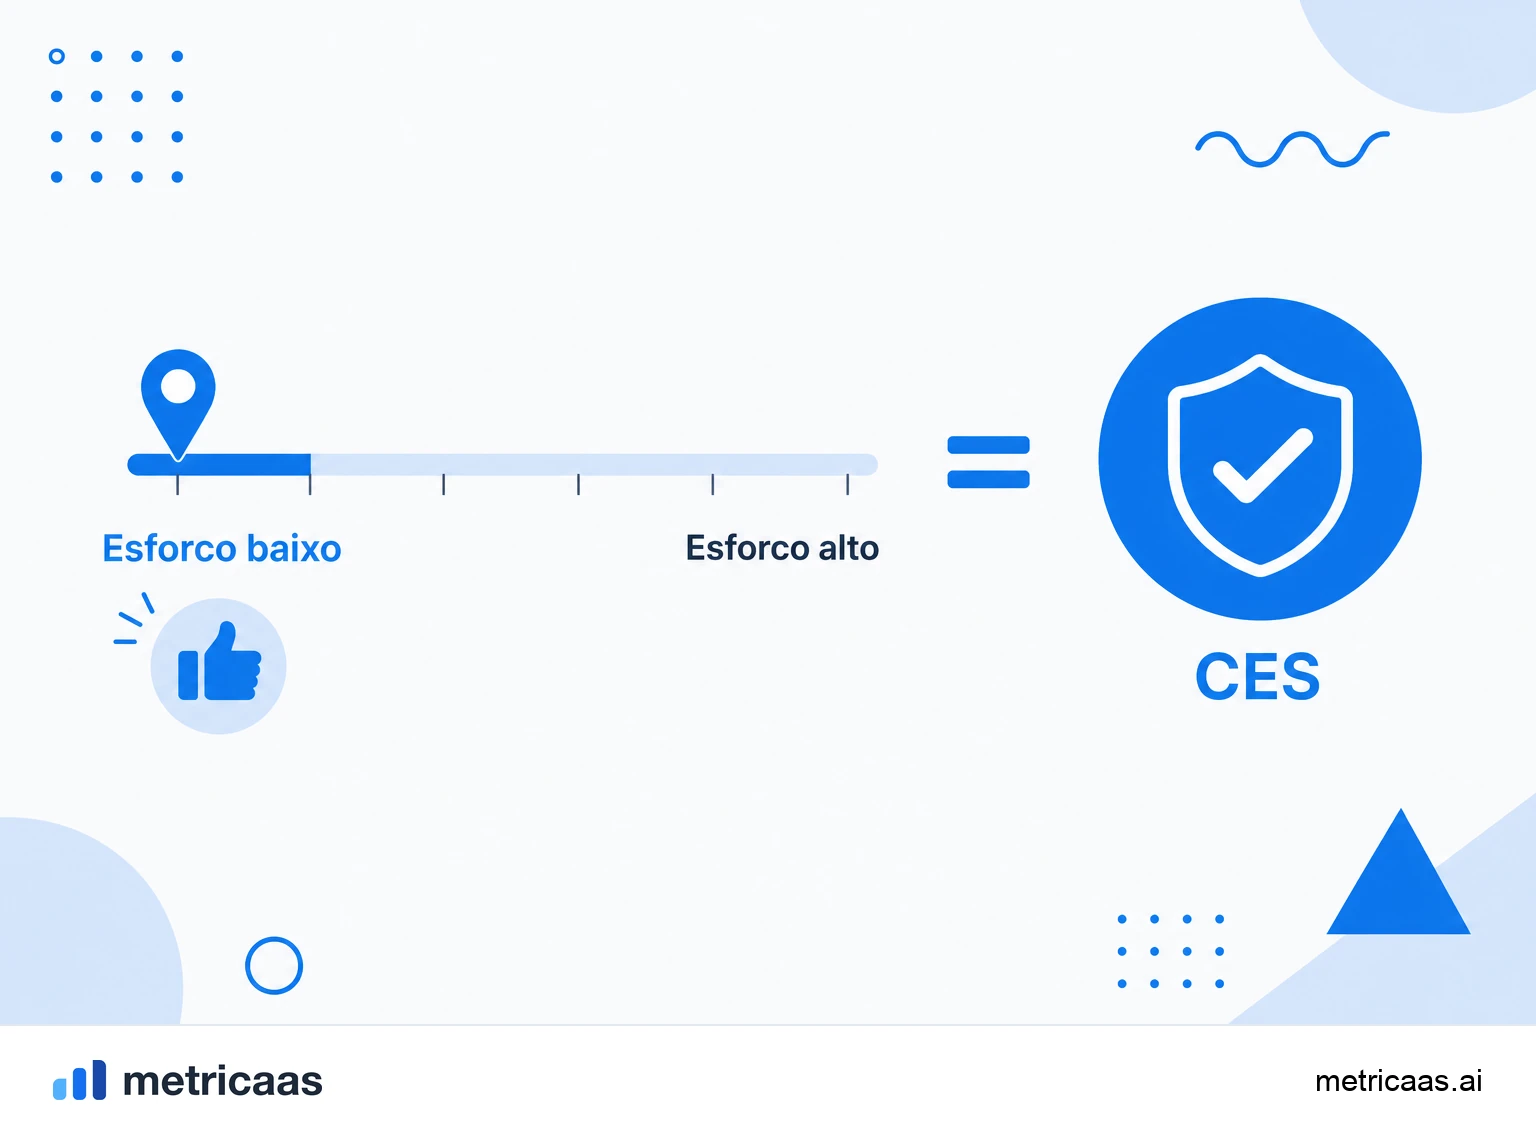
O Customer Effort Score (CES), ou pontuação de esforço do cliente, mede quanto trabalho a pessoa precisou ter para concluir uma tarefa com a sua empresa: resolver um chamado de suporte, ativar um recurso, fazer um upgrade ou finalizar uma compra. A pergunta típica é direta: "quão fácil foi resolver o que você precisava?".
A ideia por trás do CES é que a experiência não se resume a satisfação ou entusiasmo. O que costuma travar a relação é o atrito: repetir informação, esperar, procurar onde clicar, falar com três atendentes. O CES isola exatamente essa fricção e a transforma em número, o que faz dele uma métrica de produto e de operação, não apenas de percepção.
Como calcular o CES
O CES nasce de uma única pergunta respondida numa escala. Há duas versões consagradas. A original pedia para avaliar "quanto esforço você teve para resolver seu pedido" numa escala de 1 a 5, em que menos é melhor. A versão revisada, chamada CES 2.0, troca a pergunta por uma afirmação, "a empresa tornou fácil resolver meu problema", medida numa escala de concordância de 1 a 7, em que mais é melhor.
- Média: some todas as respostas e divida pelo total. É a leitura mais comum na escala de 7 pontos.
- Percentual de "fácil" (top-box): divida o número de respostas positivas (por exemplo, 5 a 7) pelo total e multiplique por 100.
Exemplo: se 80 de 100 pessoas escolhem as notas de concordância, o CES em top-box é 80%. O importante é fixar uma escala e uma pergunta e não trocá-las, senão a série histórica perde comparabilidade.
Quando medir o esforço do cliente
O CES é uma métrica transacional: deve ser perguntado logo depois de uma interação concreta, enquanto o esforço ainda está fresco na memória. Perguntar semanas depois mede lembrança, não experiência.
- Ao fechar um chamado de suporte, para medir o esforço de ser atendido.
- Ao concluir um passo de onboarding ou ativar um recurso pela primeira vez.
- Depois de um checkout, upgrade ou renovação.
- Ao usar um fluxo de autoatendimento, como a central de ajuda.
Esse gatilho contextual é o que separa o CES de pesquisas de relacionamento. Ele não pergunta o que a pessoa acha da marca; pergunta se aquela tarefa específica foi fácil.
CES, NPS e CSAT: como se complementam
As três métricas respondem perguntas diferentes e funcionam melhor juntas. O CSAT mede satisfação com uma interação ("quão satisfeito você ficou?"). O NPS mede a disposição de recomendar a marca no geral, uma leitura de relacionamento. O CES mede o esforço de uma tarefa específica e é o melhor dos três para prever se a pessoa vai voltar.
- CES: transacional, foco no atrito, prevê recompra e renovação.
- CSAT: transacional, foco na satisfação imediata.
- NPS: relacional, foco em lealdade e boca a boca.
Na prática, muitas equipes usam CES e CSAT logo após as interações e reservam o NPS para leituras periódicas do relacionamento. Nenhuma substitui a outra.
Por que menos esforço prediz mais lealdade
O CES ganhou força a partir de uma pesquisa do CEB, hoje parte da Gartner, publicada na Harvard Business Review sob o título "Pare de tentar encantar seus clientes". A conclusão contrariou o senso comum: no suporte, superar expectativas rende pouco; o que corrói a lealdade é o esforço. Reduzir o atrito previne a deslealdade melhor do que tentar surpreender.
Os números da pesquisa são fortes: a grande maioria dos clientes que passam por experiências de alto esforço fica mais propensa a abandonar a empresa, enquanto quase ninguém se torna desleal após uma experiência de baixo esforço. Por isso o CES conversa diretamente com o churn: cada ponto de fricção removido é uma razão a menos para o cliente sair.

Como usar o CES para reduzir churn
Medir é só o começo; o valor aparece quando o CES vira ação. Uma nota baixa deve puxar a pergunta "onde estava o atrito?" e disparar melhorias concretas: reescrever um passo confuso do onboarding, encurtar um fluxo de suporte, eliminar um formulário redundante.
Num mercado que só cresce, o custo do atrito aumenta. Segundo a Gartner, os gastos globais dos usuários finais com nuvem pública devem superar US$700 bilhões em 2025, e num universo de tantas opções o cliente troca de fornecedor ao primeiro obstáculo. Acompanhar o CES ao lado do churn transforma uma percepção difusa de "está difícil usar" numa lista priorizada de fricções para eliminar.
Perguntas frequentes
É a pontuação de esforço do cliente: mede quanto trabalho a pessoa precisou ter para concluir uma tarefa com a empresa, respondendo à pergunta "quão fácil foi?".
A partir de uma pergunta numa escala. Você tira a média das respostas ou o percentual de respostas positivas (top-box), dividindo as notas de concordância pelo total e multiplicando por 100.
O CES mede o esforço de uma tarefa e prevê recompra; o CSAT mede a satisfação com uma interação; o NPS mede a disposição de recomendar a marca no geral. São complementares.
A mais comum é "a empresa tornou fácil resolver meu problema", respondida numa escala de concordância de 1 a 7. A versão original perguntava quanto esforço a pessoa teve, de 1 a 5.
Não há um corte universal. As equipes leem o CES em relação ao próprio histórico e à direção em que ele se move: quanto mais gente responde que foi fácil, melhor.
Logo após uma interação concreta, enquanto o esforço está fresco: ao fechar um chamado, concluir um passo de onboarding, finalizar uma compra ou usar um fluxo de autoatendimento.
Conceitos relacionados

CSAT
CSAT (Customer Satisfaction Score) é a métrica que mede a satisfação do cliente com uma interação, produto ou momento específico, calculada como as respostas satisfeitas divididas pelo total, em percentual. É pontual e transacional, capta o sentimento no calor do momento, ao contrário do NPS, que mede lealdade de longo prazo, e do CES, que mede o esforço. Cada ponto de contato pode ter o seu próprio CSAT.

NPS
NPS (Net Promoter Score) é um índice de lealdade baseado na pergunta "de 0 a 10, o quanto você recomendaria?". Calcula-se subtraindo a porcentagem de detratores (notas 0 a 6) da de promotores (notas 9 e 10); os neutros (7 e 8) não contam. O resultado varia de -100 a +100 e mede lealdade e boca a boca, não a satisfação pontual.

Churn
Churn é a perda de clientes ou de receita num período. Num SaaS, ele mede quantos clientes cancelam (churn de clientes) ou quanto de receita recorrente desaparece (churn de receita). É a métrica que revela se o crescimento se sustenta: quanto mais alto o churn, mais novas vendas você precisa só para não encolher.