
TAM, SAM and SOM: what they are and how to size your market
By Tiago Costa · Updated on July 9, 2026

Definition
TAM, SAM and SOM are three nested market sizes that run from the theoretical total down to what you can actually capture.
- TAM: the total demand if you served everyone.
- SAM: the slice your product and model actually serve.
- SOM: what you can realistically win in the near term.
What TAM, SAM and SOM are
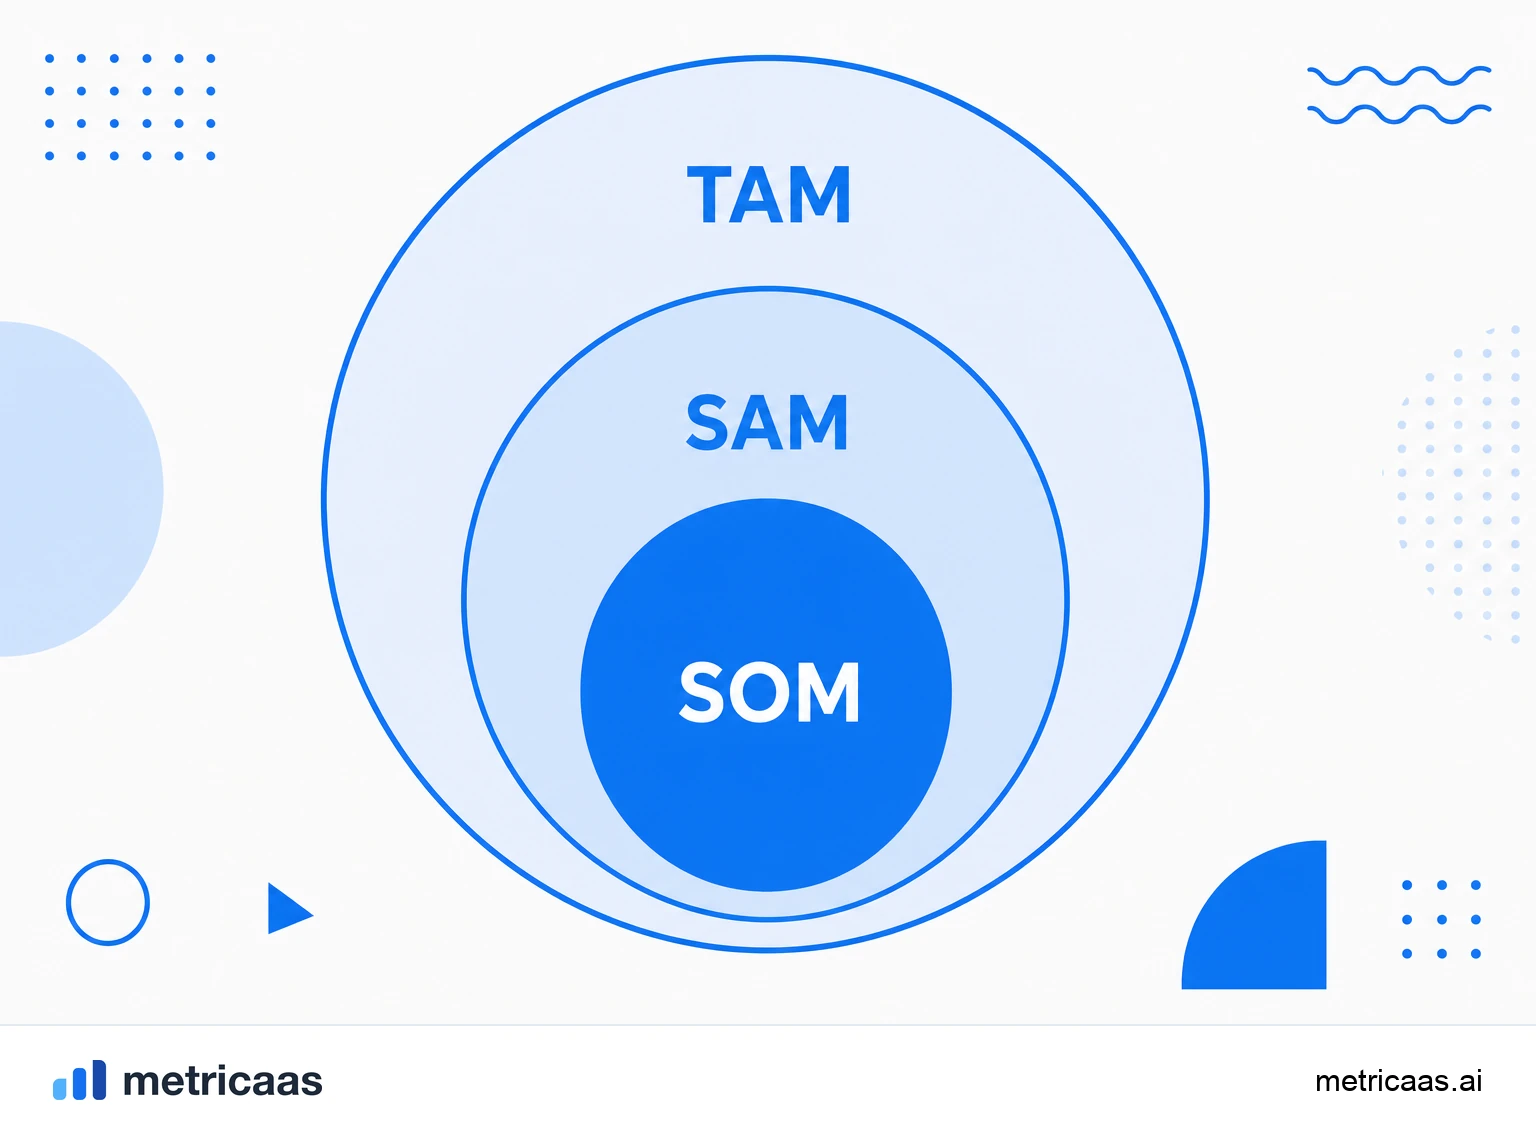
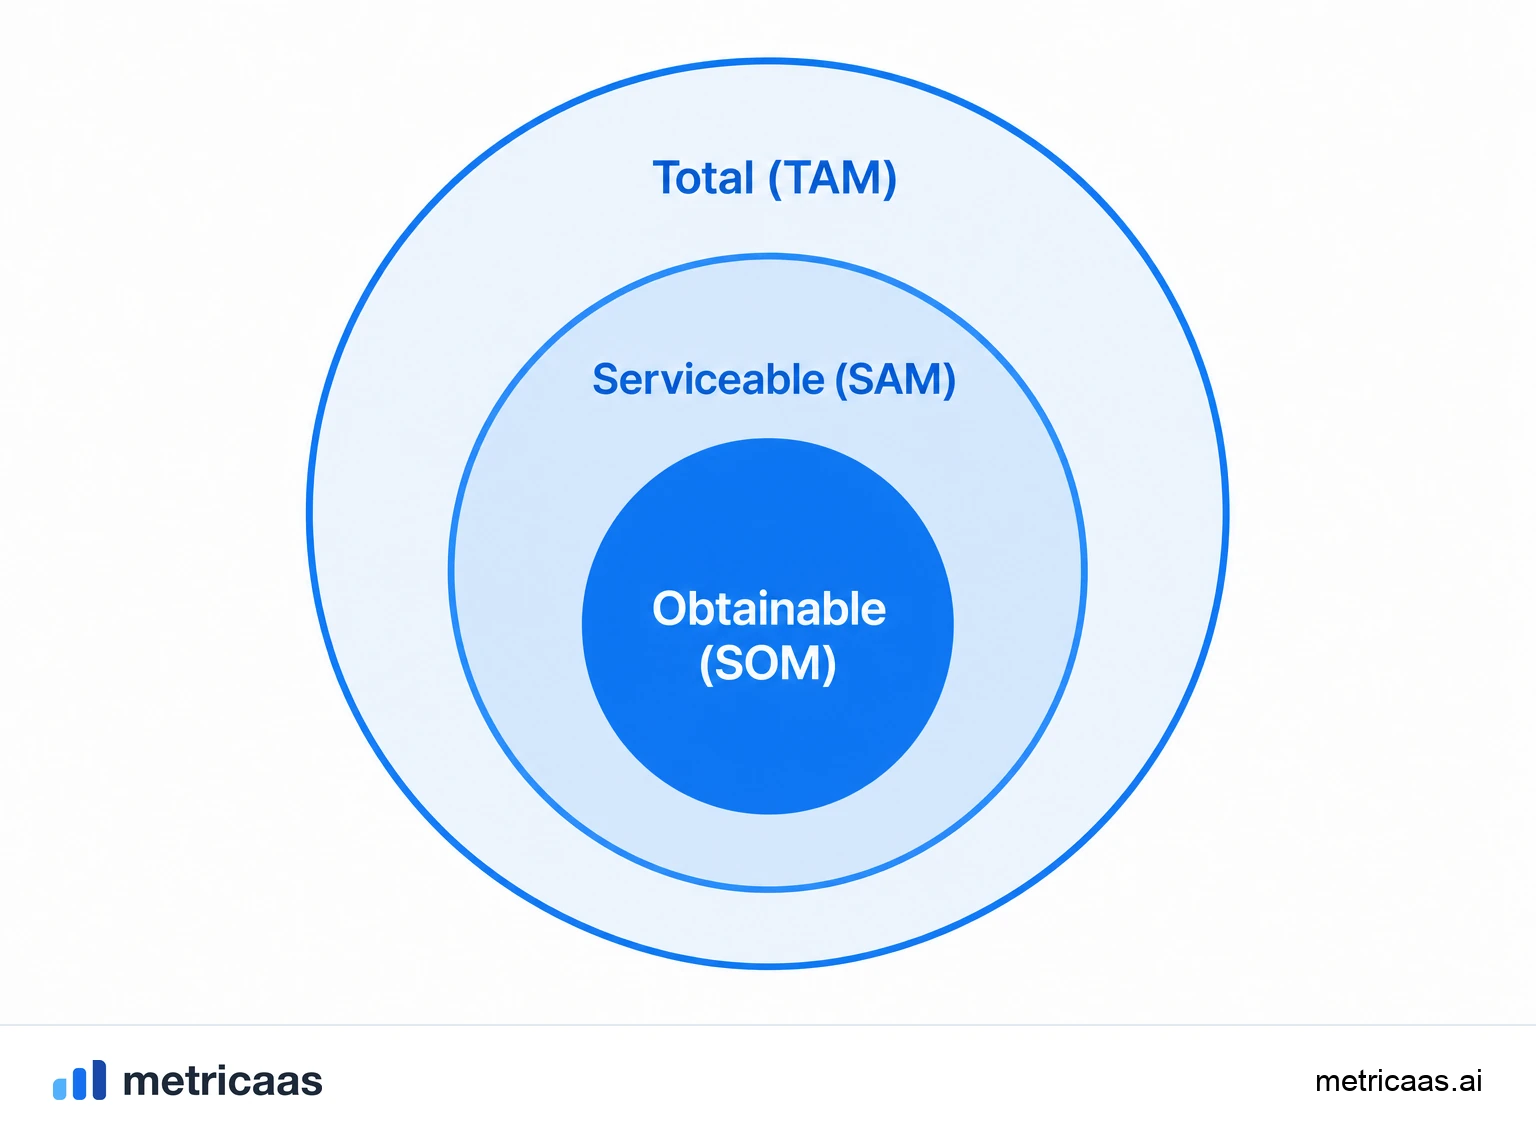
TAM, SAM and SOM are three ways to measure the same market at progressively smaller and more realistic scales. TAM (Total Addressable Market) is the revenue that would exist if every possible customer bought your product category. SAM (Serviceable Available Market) carves out of that total only the buyers your product and business model can serve. SOM (Serviceable Obtainable Market) is the share of the SAM you can realistically win over a one to three year horizon.
The best picture is three concentric circles: TAM on the outside, SAM in the middle, SOM at the center. Each layer answers a different question. TAM states the size of the opportunity; SAM states where you play; SOM states how much of that turns into contracts in the near term. Confusing the three is the root of almost every market sizing error.
How to calculate TAM: top-down and bottom-up
There are two ways to estimate TAM, and the ideal is to use both to check one against the other. In the top-down approach, you start from a market number published by a research firm and narrow it by region, segment and profile. When Gartner forecasts that worldwide public cloud spending will reach about $723 billion in 2025, it describes something close to an industry TAM, of which your category is a fraction.
In the bottom-up approach, you build the number from the ground up: how many companies or people fit the profile, multiplied by the average annual price they would pay. Bottom-up tends to be more reliable because it comes from your own price and audience assumptions, not from a generic report.
- Top-down TAM = published market size x the share that matches your category.
- Bottom-up TAM = total number of potential customers x average annual revenue per customer.
SAM: the slice your product actually serves
The SAM lands the TAM in the reality of your product. Not all of the total market can buy from you: there are barriers of language, currency, regulation, company size and channel. The SAM is the piece of the TAM that your current product, in the language and plans you offer today, can serve. This is where your ICP comes in, because it defines precisely who the customer you actually serve is.
An example helps. If the TAM is global spending on a software category, the SAM may be only mid-market companies, in countries where you bill in the local currency and support the right time zone. Narrowing the TAM down to the SAM does not shrink ambition; it makes clear where the ambition is executable today.
SOM: what you can realistically capture near term
The SOM is the part of the SAM you can convert into real customers in one to three years, given your sales team, your marketing budget and the competition. It is the most honest of the three numbers, because it depends less on market estimates and more on your real ability to execute. A good SOM comes out of the funnel: expected conversion rate, sales cycle and delivery capacity.
In practice, the SOM is limited by your Go-to-market (GTM). You can have a huge SAM and still capture little in the first year if the acquisition channel is slow or expensive. That is why the SOM is usually expressed as a small fraction of the SAM, somewhere between one and ten percent early on, growing as the sales engine matures.
TAM, SAM, SOM and the valuation narrative
The three numbers tell a story to investors, and each one plays a role. TAM shows the ceiling is high enough to justify the risk; funds like Bessemer and firms like McKinsey favor large markets because that is where large companies fit. SAM shows focus, that you know exactly where you will play. SOM shows realism, that you have a credible plan for the next few years.
This trio feeds directly into Valuation. A large TAM supports the multiple, but only a defensible SOM convinces anyone that the projected growth is attainable. A seasoned investor distrusts a founder who only talks about the billion dollar TAM and cannot say what share they can win next year.
Common mistakes in market sizing
The most frequent mistake is inflating the TAM. Multiplying the entire population of the planet by a full price produces an impressive and useless number, because no one believes it. An inflated TAM destroys credibility instead of building it, and usually hides the lack of a well thought out SAM and SOM.
- Fantasy TAM: using the whole world market when you only serve one country or one segment.
- Skipping the SAM: jumping straight from TAM to SOM without explaining who your product actually serves.
- Over-optimistic SOM: assuming a market share no competitor has ever reached in that timeframe.
- Single number: presenting only the top-down without checking against a bottom-up, or the other way around.
The discipline is always the same: anchor each layer in verifiable assumptions, show the math, and let the SOM be the modest, honest number it should be.
Frequently asked questions
They are three nested market sizes. TAM is the total demand if you served everyone, SAM is the slice your product and model serve, and SOM is what you can realistically capture in the near term.
It is one of scale. TAM is the total theoretical market, SAM carves out who your product can actually serve, and SOM is the share of that SAM you can realistically win in one to three years.
TAM comes from the market size (top-down) or from the number of potential customers times the average annual price (bottom-up). SAM applies the filters of your ICP and model. SOM starts from the sales funnel and your capacity to execute.
It is used to size the opportunity, show focus and support the valuation narrative. TAM shows the ceiling, SAM shows where you play, and SOM shows what is attainable in the near term.
TAM is Total Addressable Market, SAM is Serviceable Available Market, and SOM is Serviceable Obtainable Market.
Anchor the number in verifiable assumptions, use bottom-up to check the top-down, and do not multiply the whole world by a full price. A realistic TAM with coherent SAM and SOM is worth more than a giant number with no basis.
Related concepts

ICP
The ICP (Ideal Customer Profile) describes the type of company that gets the most value from your product and gives the most back in retention, expansion and referrals. It combines firmographics (industry, size, geography), the real need the product solves and fit criteria. Focusing on the ICP lowers CAC and improves retention; targeting outside it inflates cost and churn.

Go-to-market (GTM)
Go-to-market (GTM) is the strategy for how a company takes a product to market: who the target customer is, through which channels, with what message, pricing and sales motion. It is not just the launch, it is the system that connects the product to revenue. The three main motions are product-led, sales-led and marketing-led, almost always combined.

Valuation
Valuation is the estimate of what a company is worth at a given moment. In SaaS, the most common shortcut is a multiple on ARR, and that multiple rises or falls with growth, retention and efficiency, synthesized by the Rule of 40. Valuation also sets how much equity an investor gets for their check, separating pre-money (before the check) from post-money (after).